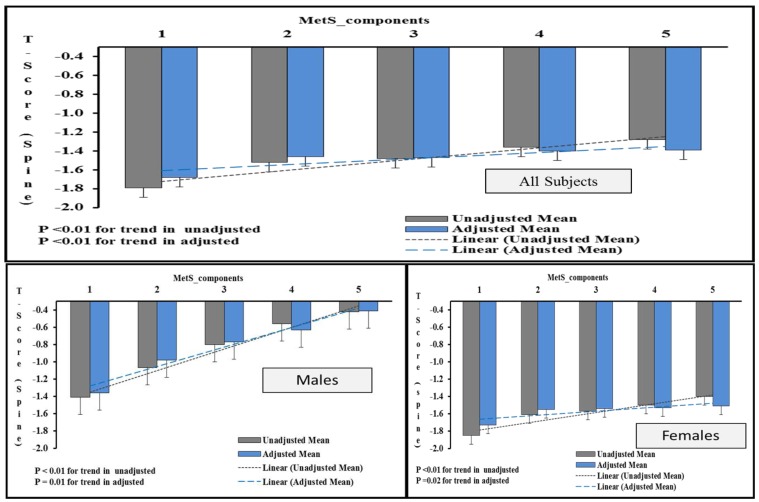
Figure 1.
Increasing T-score (spine) values with increasing MetS components according to sex. Note: The figure shows the average T-score (spine) in participants with 1 or more MetS components. The data was generated by univariate analysis by taking T-score (spine) values as dependent variables and “number of components” as factors. The values were adjusted for age, BMI and other risk factors associated with bone loss. p < 0.05 was considered as significant.

