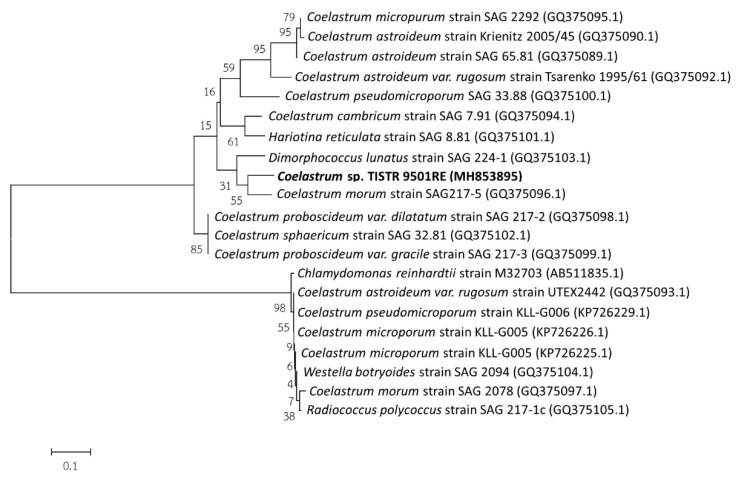
Figure 3.
Maximum likelihood (ML) tree from the sequence-structure analysis of the ITS sequence data. The tree was generated by the neighbor joining method using the Molecular Evolutionary Genetic Analysis (MEGA6) software. The bootstrap value is expressed as a percentage of 100 replicates. The nucleotide sequence accession numbers are indicated in parentheses.

