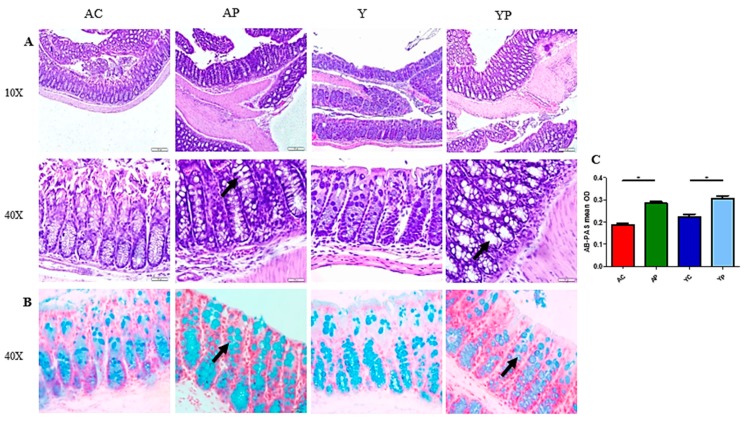
Figure 2.
Representation of distal colon sections stained with haematoxylin and eosin (A) and AB-PAS staining (B) for sulphated mucins among the four groups. (C) The AB-PAS staining mean optical density of goblet cells observed in the young control group (YC), young probiotic group (YP), aging control group (AC) and aging probiotic group (AP). Magnification is reported, and the arrow indicates location goblet cells. * p < 0.005 (one-way ANOVA with Tukey’s post-hoc test and data are expressed as the mean ± SEM).

