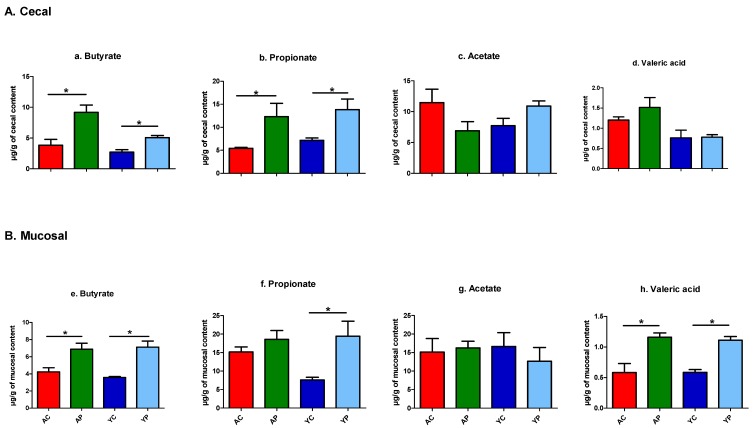
Figure 8.
Short-chain fatty acid (SCFA) distribution observed in the young control group (YC), young probiotic group (YP), aging control group (AC) and aging probiotic group (AP). The concentrations of butyrate, propionate, acetate and valeric acid in the caecal (n = 5) (A) and mucosal (n = 5) (B) samples were measured by GC-MS analysis from caecal and mucosal contents at the end of the study. * p < 0.05 (One-way ANOVA with Tukey’s post-hoc test and data are expressed as the mean ± SEM).

