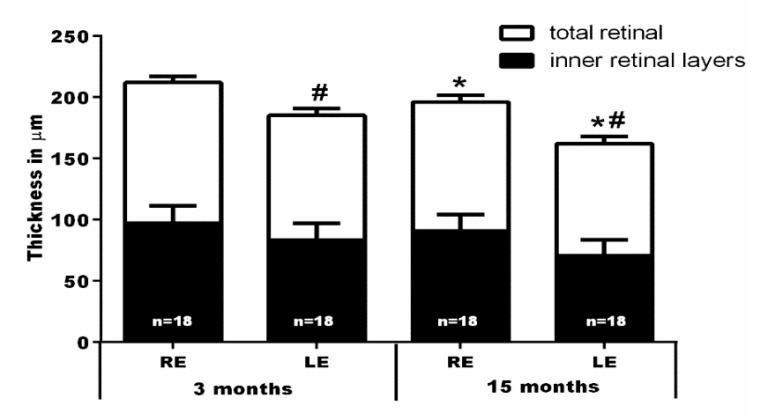
Figure 6.
Graph bars showing the reduction of the mean ± SD thickness (µm) of the total (from inner side of the nerve fiber layer to outer segment layer) and inner (from the inner side of the nerve fiber layer to outer margin of inner nuclear layer) retina after NMDA intravireal injection into the left eye, measured in the volume scan analyses shown in Figure 5. Note: * Significant differences compared to the same eyes analyzed at 3 months (Kruskal-Wallis test, p < 0.001); # significant differences when compared to their contralateral eyes at the same time interval (Mann-Whitney Test, p < 0.001); RE = right fellow eye; LE = left eye (NMDA-injected).

