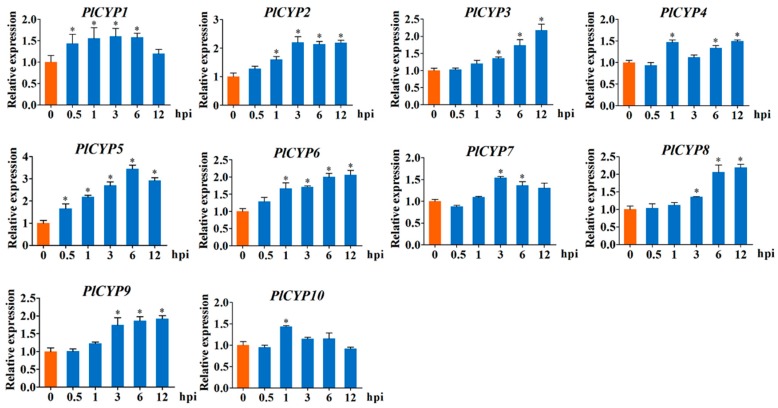
Figure 5.
Expression levels of PlCYPs at the Meloidogyne incongnita parasitic egg stage. Relative expression levels of PlCYPs at 0.5, 1, 3, 6, and 12 h post inoculation (hpi) versus the control with no eggs. The β-actin and tubulin genes were used as internal controls to normalize the data. The error bar represents the SD of three replicates. * denotes p < 0.01 in the variance analysis.

