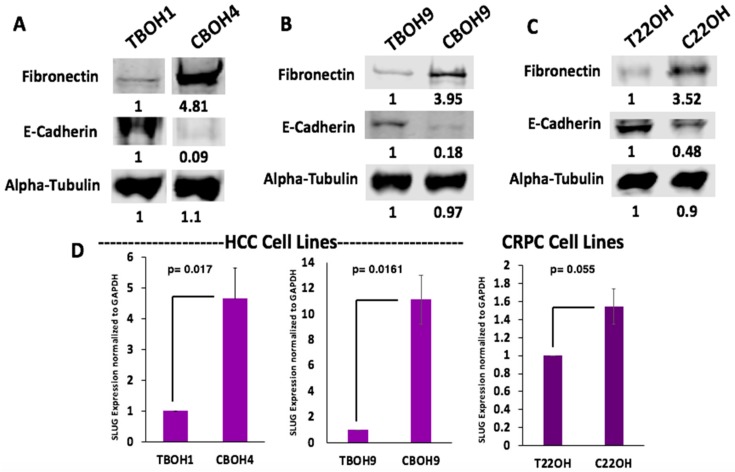
Figure 4.
CTCs undergo epithelial-to-mesenchymal transition (EMT) as observed by increased fibronectin, decreased E-cadherin, and increased SLUG expression. (A,B) Fibronectin and E-cadherin protein expression by HCC primary tumor-derived cell lines and CTC lines. (C) Fibronectin and E-cadherin protein expression by CRPC primary tumor-derived cell line and CTC line. (D) SLUG expression was assessed using qPCR. Expression was normalized against GAPDH. Data provided on graphs are presented as mean ± standard error of the mean (SEM); N = 3.

