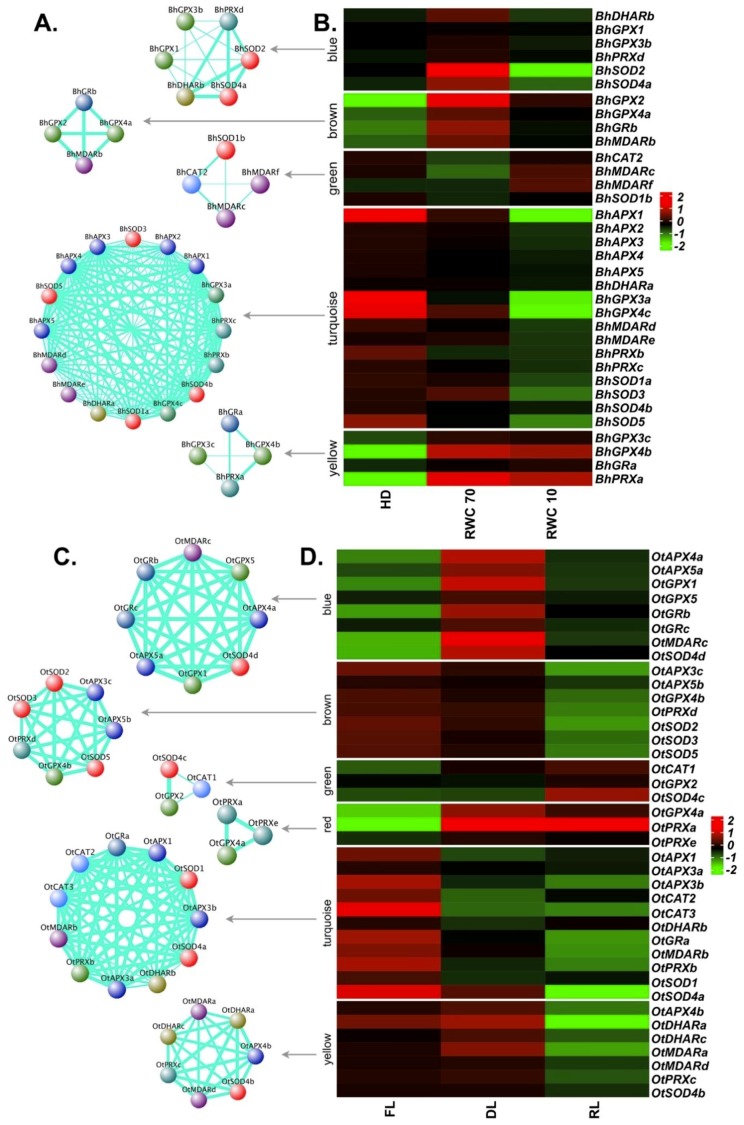
Figure 5.
Co-expression network and expression profiles for each module of reactive oxygen species (ROS)-related genes in B. hygrometrica and O. thomaeum. (A,B) B. hygrometrica. (C,D) O. thomaeum. (A,C) Each module is represented as a co-expression network obtained from weighted gene correlation network analysis (WGCNA) analysis. Nodes correspond to a gene and are colored based on the gene family. Thickness of the edges represent the weight. Edges below adjacency threshold of 0.02 and the nodes without edges were removed. (B,D) Expression profile for all the genes in the module are plotted as a heatmap. Color scale represents the log2 transformed and mean centered TMM values. HD: fully hydrated; RWC: relative water content; FL: fresh leaves; DL: desiccated leaves; RL: rehydrated leaves. RWC is calculated as (fresh weight–dry weight) × 100/(turgid weight–dry weight).

