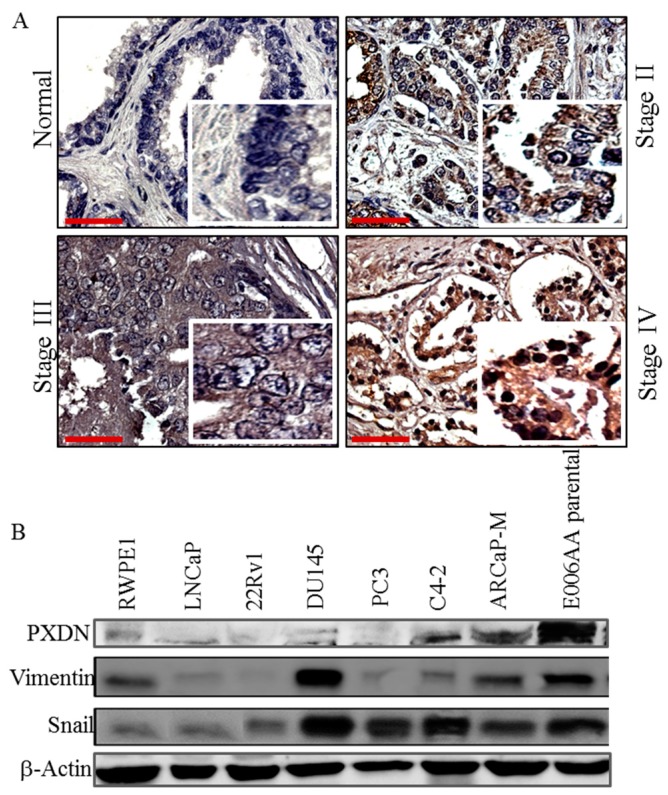
Figure 1.
PXDN expression increases with prostate cancer progression. (A) Immunohistochemical (IHC) analysis was performed using a 96-core prostate adenocarcinoma tissue microarray. Representative images of PXDN in various stages of prostate cancer show that PXDN increases with tumor progression. Bar represents 50 µM. (B) Western blot analysis was performed on RWPE1 normal transformed epithelial cell line and various prostate cancer cell lines with antibody against PXDN or mesenchymal markers Snail and vimentin. Actin was utilized as a loading control. Data are representative of at least 3 independent experiments.

