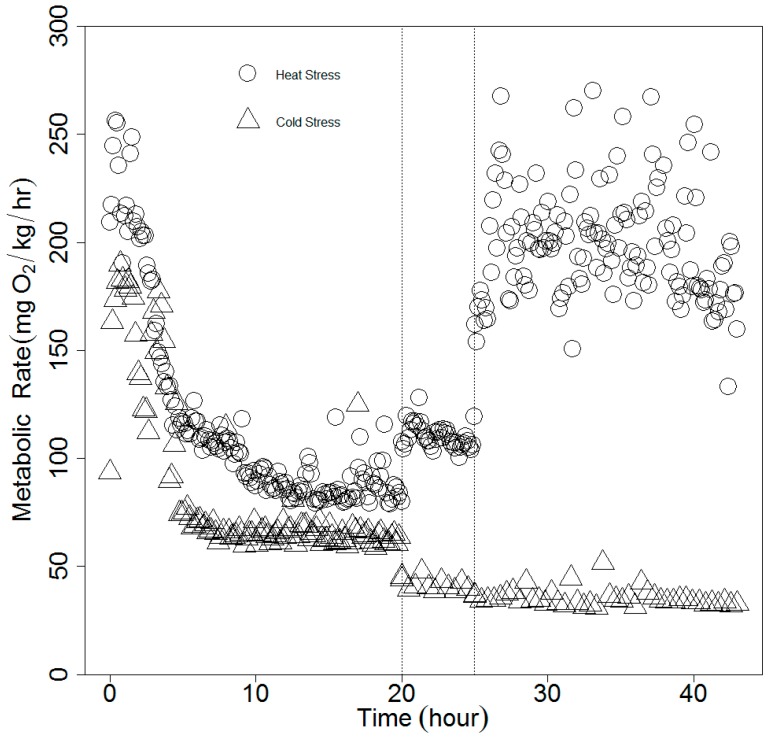
Figure 2.
Time course of metabolic rate change in spotted seatrout under two sets of experimental conditions. Empty circles: heat stress; empty triangles: cold stress. Each dot represents the oxygen consumption rate from one respirometry cycle. Vertical dotted lines separate different temperatures. Within each treatment, from left to right: 20 °C, 25 °C, 30 °C (heat stress); 15 °C, 10 °C, 5 °C (cold stress).

