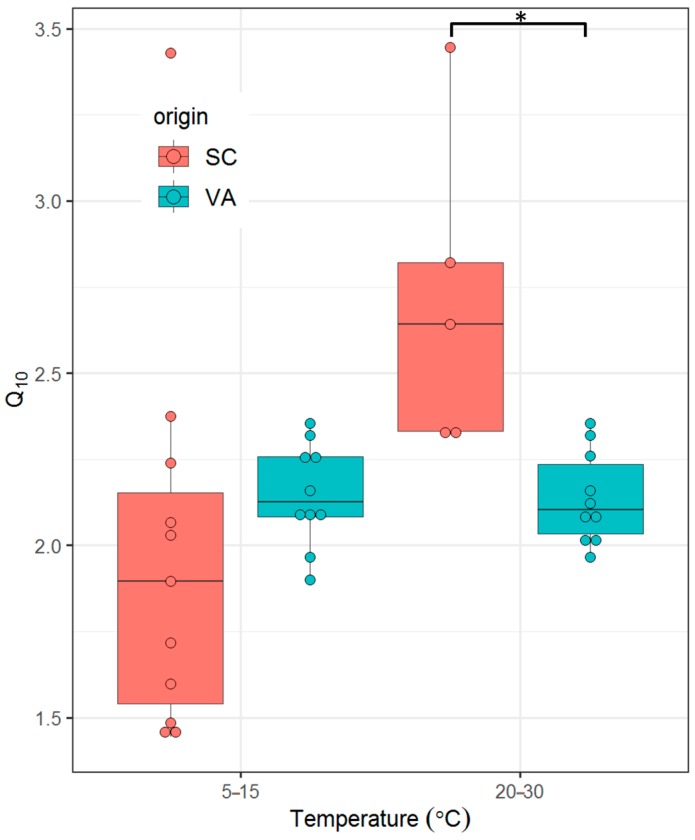
Figure 6.
Temperature coefficient (Q10) of spotted seatrout between northern and southern spotted seatrout populations subjected to cold stress (5 to 15 °C) and heat stress (20 to 30 °C). SC = southern population, VA = northern population. Asterisks indicate significant differences between groups (p ≤ 0.05, two tailed Student’s t-test).

