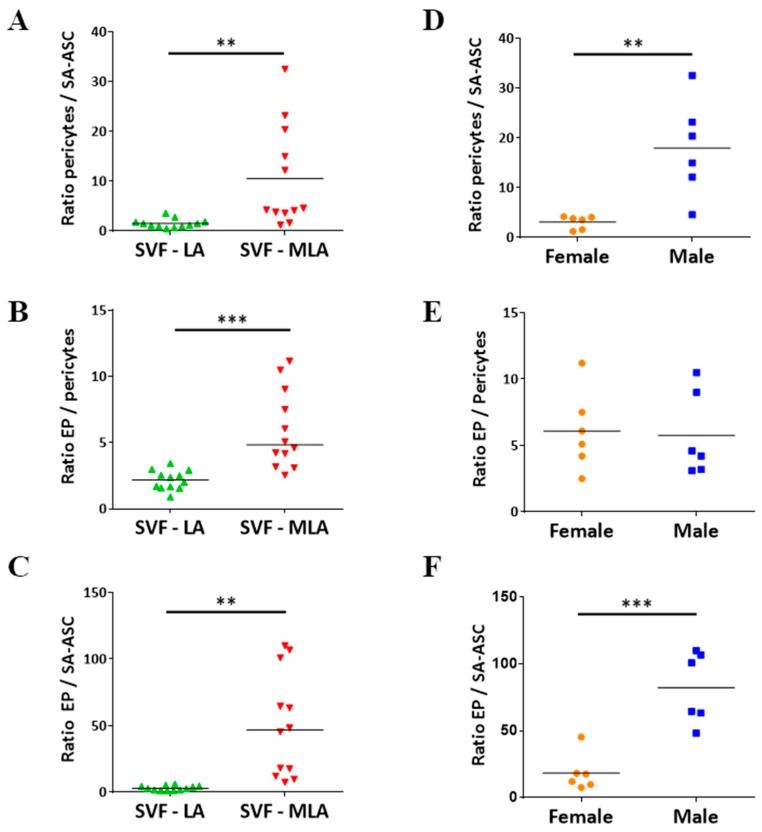
Figure 6.
Comparative analysis of four cell subpopulations in SVF cells obtained from (SVF-LA or its SVF-MLA counterpart. Graphs A–C show a difference in the ratios of the three progenitor subpopulations between SVF-LA and SVF-MLA. Differences in the ratios of the three progenitor subpopulations in the SVF-MLA samples between female and male patients are shown in graphs D–F. p-values: (**) p < 0.01; (***) p < 0.001; n = 12.

