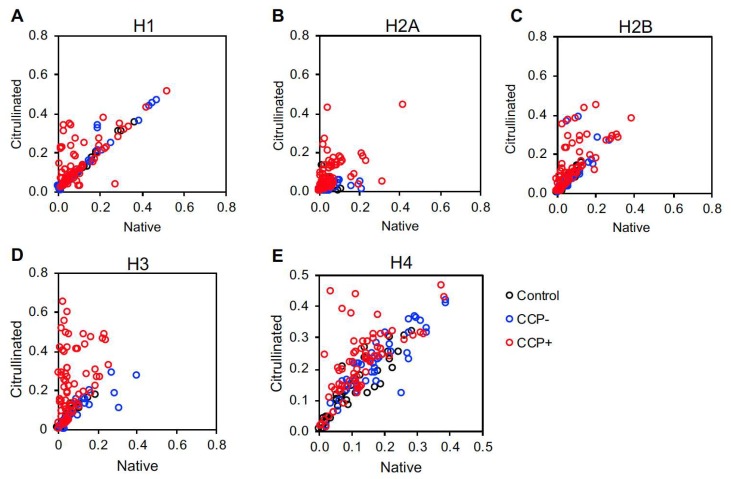
Figure 3.
Native versus citrullinated histone autoantibody targeting in controls and rheumatoid arthritis. IgG levels against native and citrullinated histone H1 (A), histone H2A (B), histone H2B (C), histone H3 (D) and histone H4 (E) measured by ELISA for controls, CCP− and CCP+ rheumatoid arthritis (RA) were compared by plotting anti-citrullinated histone antibody levels on the Y axis and anti-native histone antibody levels on the X axis. For all panels, n = 39 controls, n = 41 CCP− RA, n = 70 CCP+ RA.

