Figure 7.
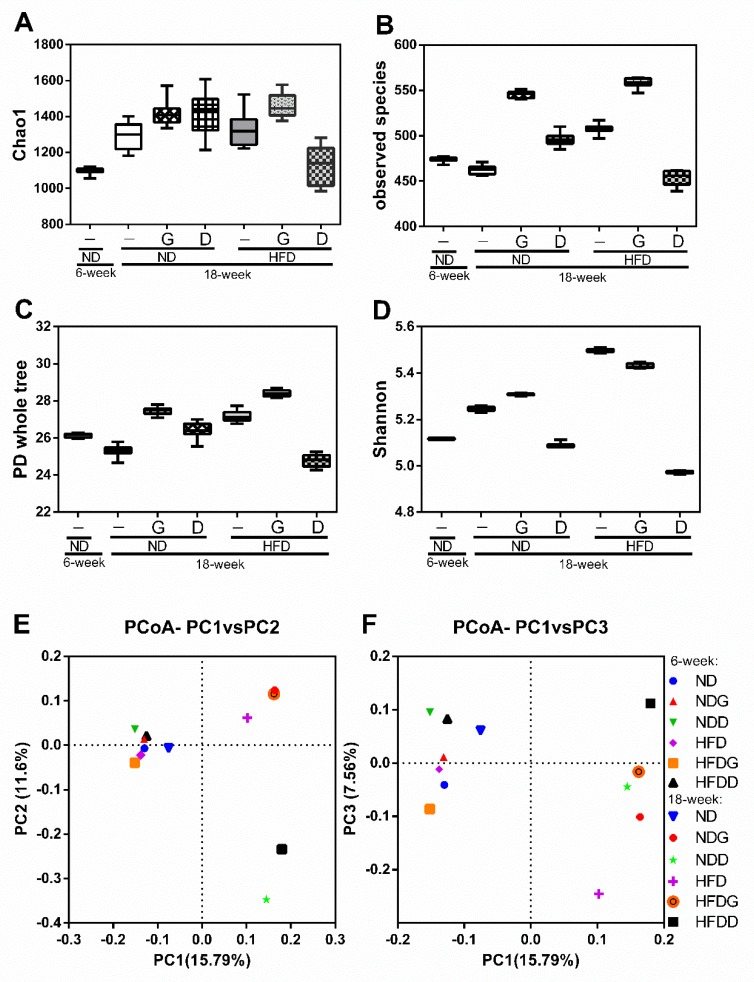
Effects of garlic supplementation on the gut microbiome. The taxa richness of the gut microbiome assessed by α-diversity analyses using Chao1 value (A), observed species index (B), PD whole tree index (C), and Shannon index (D). The data represent the median and range of ten alpha rarefaction values. The species compositions of the gut microbiomes were assessed by β-diversity analyses using principal coordinate analysis (PCoA) of the unweighted UniFrac distance matrices, which is showed in PC1 vs. PC2 (E) and PC2 vs. PC3 (F). Each dot in (E) and (F) represents the beginning (6-week) or ending point (18-week) of the experiment for each group (n = 8).

