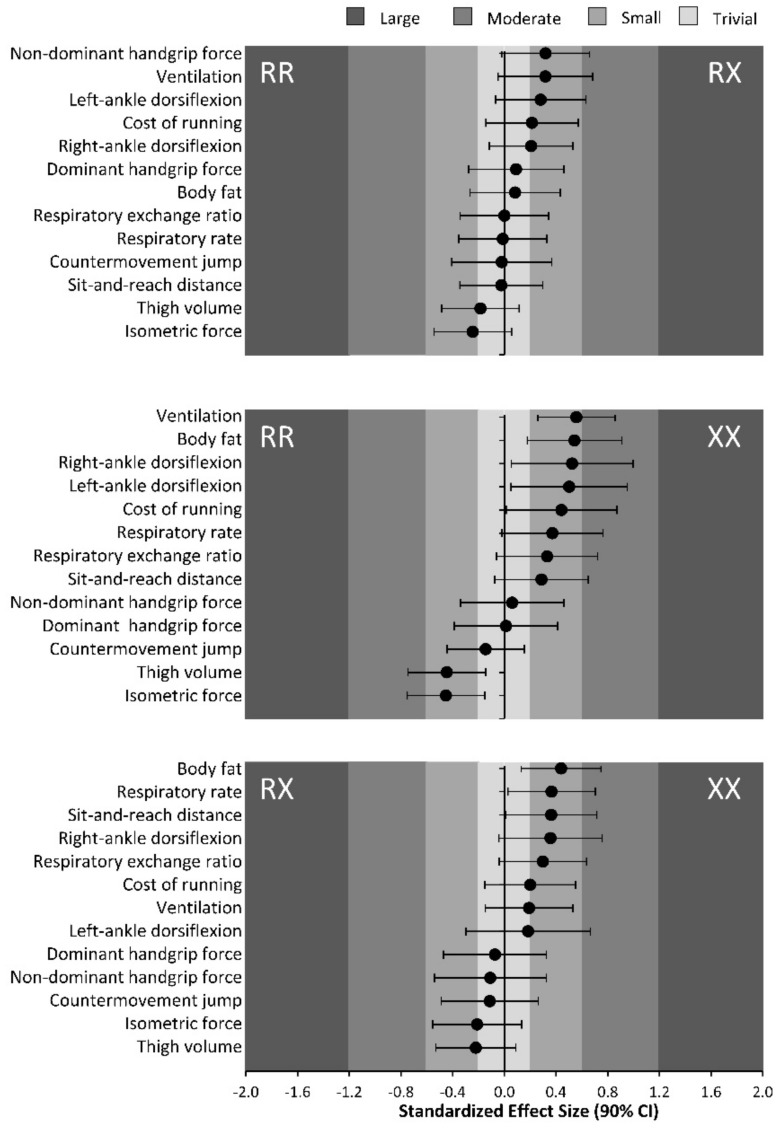
Figure 4.
Magnitude of the ACTN3 genotype effect, calculated with Hedges’ g ± 95% confidence interval, on the phenotypes investigated for the comparison of RR vs. RX (upper panel), RR vs. XX (middle panel), and RX vs. XX (lower panel) genotypes. Negative values indicate higher values of the variable for the group categorized at the left. Positive values indicate higher values of the variable for the group categorized at the right.

