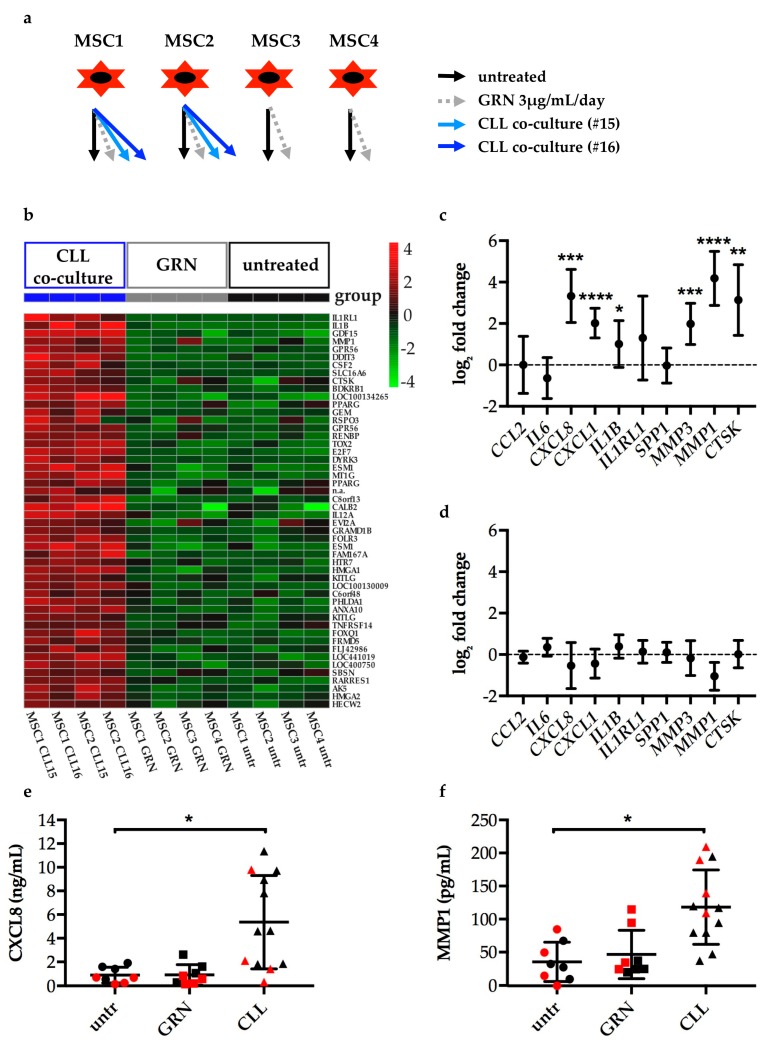
Figure 3.
Mesenchymal stromal cells (MSCs) in co-culture with CLL cells acquire a cancer-associated fibroblast (CAF)-like phenotype which is not recapitulated by GRN treatment. (a) Scheme of 12 samples that were submitted for gene expression profiling (GEP) by Illumina BeadChip arrays. Human primary MSCs were either left untreated (black), treated with 3 µg/mL/day GRN (grey), or co-cultured with CD19-sorted CLL cells of two different patients (blue, #15 and #16, patient characteristics according to Supplementary Table S3) for 5 days. CLL cells were thoroughly removed from co-cultures before RNA isolation. (b) Heatmap of the top 50 upregulated genes in MSCs by CLL co-culture determined by Illumina BeadChip array analysis (listed in Supplementary Table S4). The plot shows mean-centered expression values for the respective Illumina probes of all samples including GRN treated ones. (c) Gene expression of MSCs co-cultured with CD19-sorted CLL cells for 3 days was determined by quantitative real-time PCR (qPCR). Data analysis was performed by ∆∆Ct method relative to the reference gene VIM and the untreated MSC control. Normalization to ACTG1, RPS29, and FTL showed similar results. Fold changes were log2 transformed. Plots show mean log2 fold change with SD, n = 8 different MSC donor and CLL donor combinations. One-sample t test was performed comparing log2 fold changes to 0. * p < 0.05, ** p < 0.01, *** p < 0.001, **** p < 0.0001. (d) Gene expression of MSCs treated with 3 µg/mL/day GRN for 3 days was determined by qPCR. Data display and analysis analogous to (c). n = 4 independent experiments using MSCs from 2 donors. All p values > 0.05. (e,f) CXCL8 or MMP1 in cell culture supernatants of samples analyzed by GEP (red data points) and qPCR shown in c and d (black data points) were quantified by cytometric bead array or ELISA, respectively. n = 8 (untreated and GRN treated MSCs); n = 12 (co-cultures). Means and SD are plotted. Wilcoxon matched-pairs signed rank tests were performed for untreated vs. GRN treated group (8 pairs, p values > 0.05) and untreated vs. CLL co-cultured group (6 pairs, using means of two technical replicates for CLL co-cultures, p = 0.0312 (MMP1), p = 0.0312 (CXCL8)).

