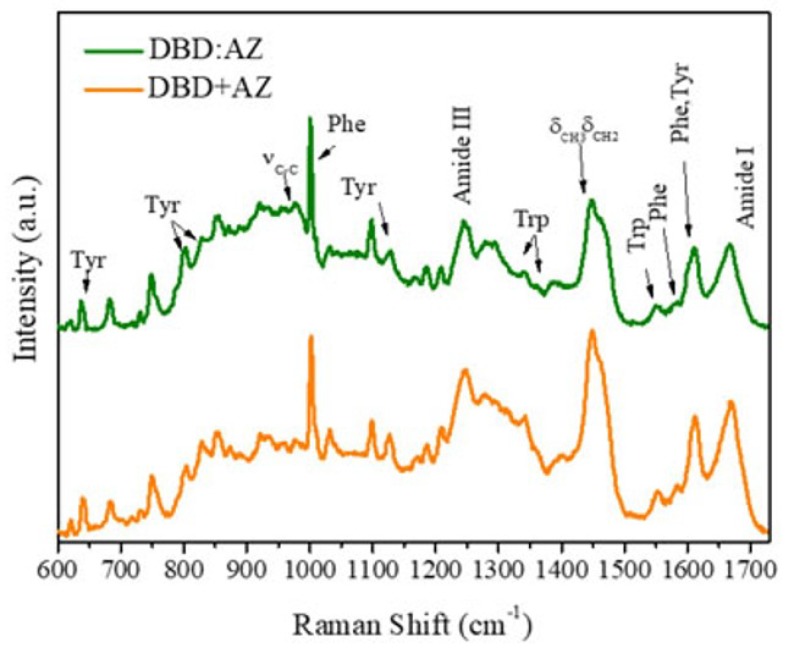
Figure 4.
Comparison among the 532-nm-excited Raman spectra (600–1730 cm−1) of DBD:AZ complex (green) and of added spectrum AS (orange) in PBS: The principal proteins’ vibrational modes are marked. Spectra were normalized in the all spectrum frequency region and baseline corrected for a better visualization.

