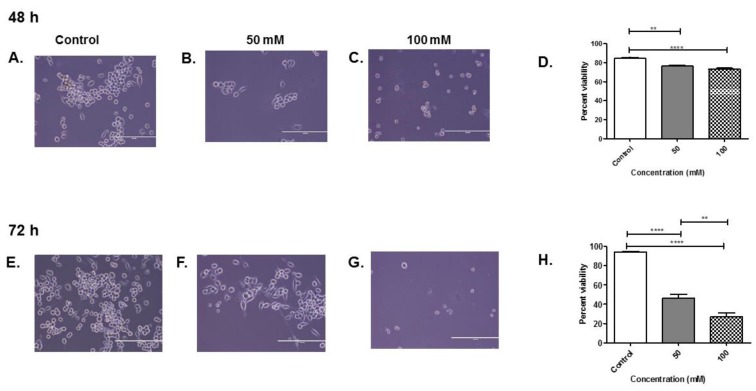
Figure 1.
Effects of EtOH on microglial cell line BV-2 cells. BV-2 cells were treated with ETOH for (A–C) 48 or (E–G) 72 h. (D,H) At 48 and 72 h, EtOH administration of cell viability was assessed by trypan blue exclusion assay. Photos were captured at 20× magnification (A–C,E–G). The scale bar = 400 µm. Data are presented as mean ± SEM. Significant differences were determined using one-way ANOVA with post hoc Tukey’s analysis. Significance is defined as (**) p ≤ 0.01, (****) p ≤ 0.0001.

