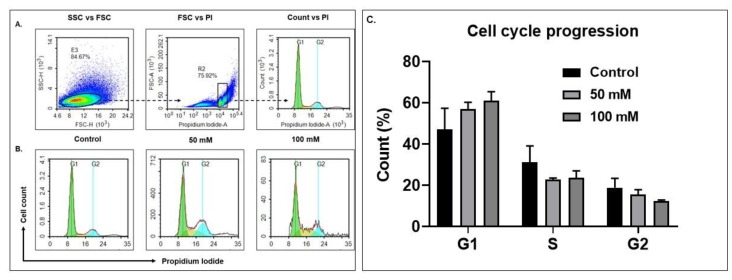
Figure 3.
EtOH exposure modulate cell-cycle progression in BV-2 cell lines. For cell-cycle analysis at 72-h EtOH treatment, intracellular DNA was labeled with PI possessing a high affinity with DNA, and was used to detect DNA content during cell division. (A) Schematic representation (live cells were gated to exclude duplets cells (R2: 75.92%) and these cells were used to plot a cell-cycle histogram (count vs. PI)). (B) Cell-cycle phases (G1, S and G2) post-exposure with 50 and 100 mM, and (C). Comparative histogram of the different phases of the cell cycle (Control, 50 and 100 mM).

