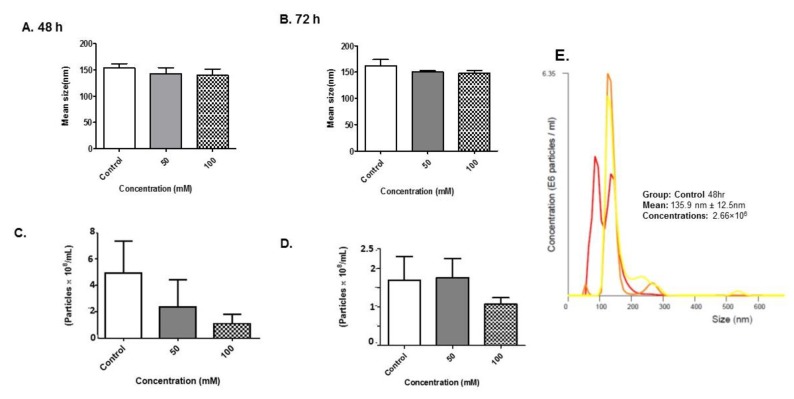
Figure 4.
Nanoparticle tracking analyses validation of BV-2-derived exosomes. NTA-generated (A,B) size and (C,D) concentration of vesicles obtained from five independent experiments after EtOH administration. (E) Histogram plot of control exosomes collected at 48 h. The different colored lines represent different pools of exosomes.

