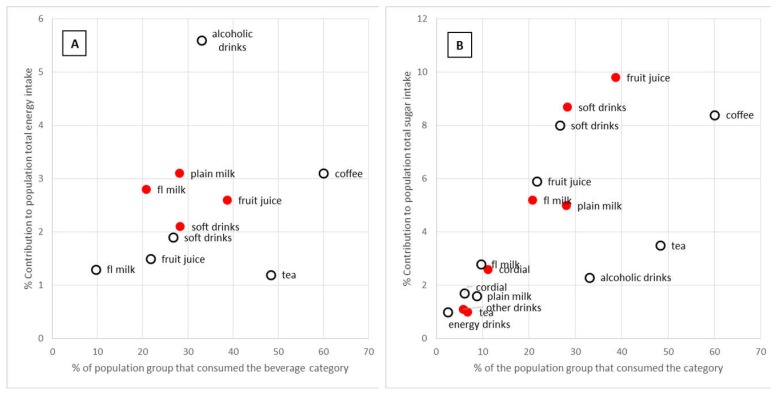
Figure 3.
The contribution of beverage categories to (A) total dietary energy intake and (B) total sugar intake for Australian children (2 to 18 years,  ) and adults (19 years and older,
  ) by the prevalence of consumption on the day of the survey. Only categories contributing 1% or more to the total energy or nutrient intake are shown.

