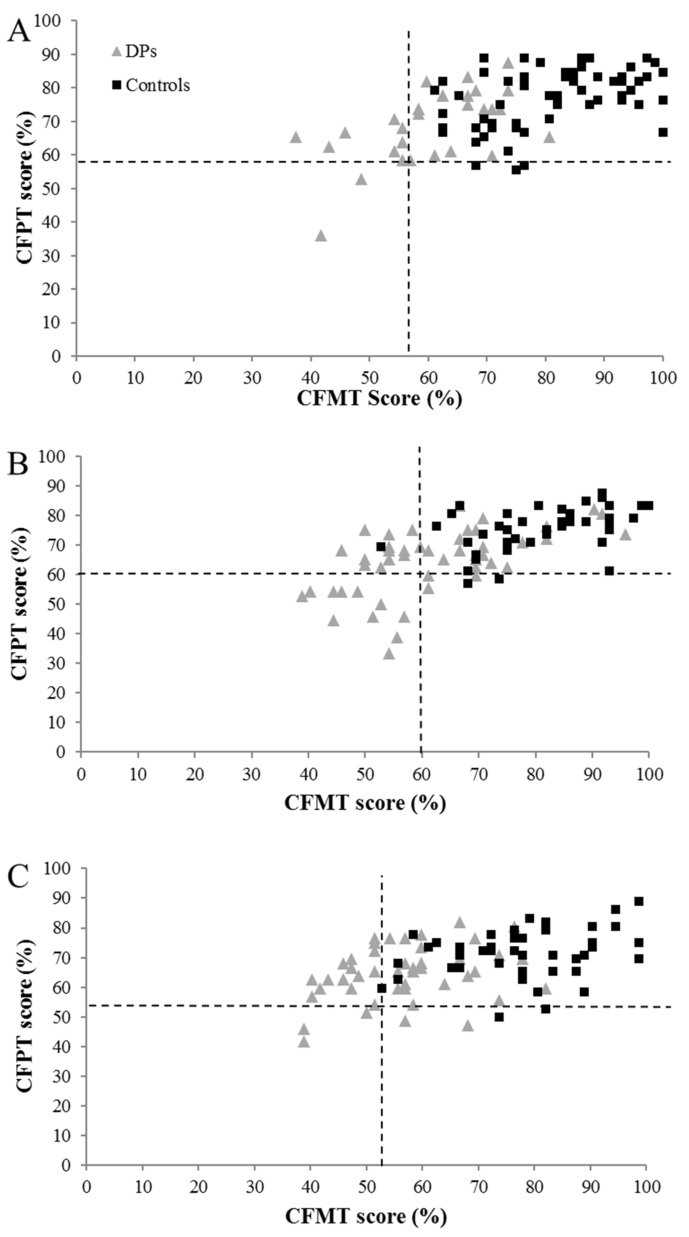
Figure 1.
Relationship between CFMT and CFPT scores in the self-referred DP and control groups, for (A) 18–34 year olds, (B) 35–49 year olds, and (C) 50–59 year olds (those aged over 60 years are not displayed as more varied performance prohibits interpretation). Dotted lines represent two SDs from the control mean.

