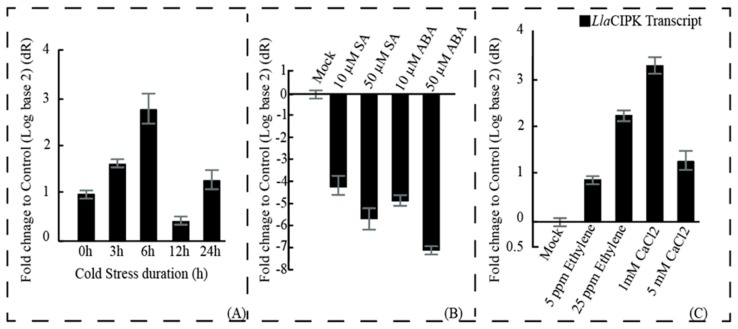
Figure 4.
Analysis of LlaCIPK expression profiles in Lepidium seedlings subjected to different treatments: (A) The Lepidium seedlings were subjected to cold stress (4 °C) for the indicated times (0, 3, 6, 12 and 24 h), (B) The seedlings were sprayed with different concentrations of SA and ABA solution. (C) The seedlings were sprayed with different concentrations of Ethylene and CaCl2 solution. The expression level of LlaCIPK at 0 h or in mock treatments was used as control (calibrator). Relative transcript abundance was calculated using the comparative 2-ΔΔCT (cycle threshold) method. Error bars represent standard error of means based on three independent biological replicates.

