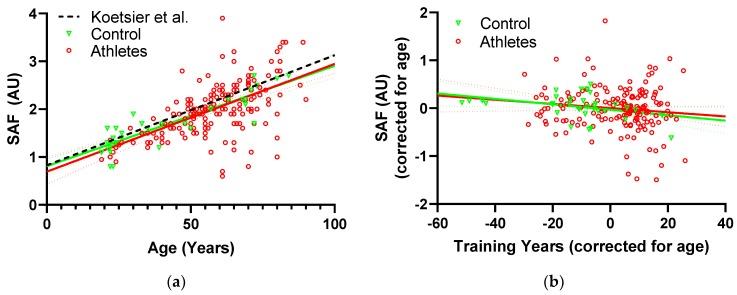
Figure 1.
(a) SAF as a function of age in controls (green) and athletes (red) with associated linear regressions and 95% confidence intervals. The fit obtained by Koetsier et al. [33] on a general non-smoking population is included for comparison (black), (b) SAF as a function of training years after correcting for age. Values on the x- and y-axes represent residuals after regression to age (i.e., for each participant how much lower/higher was the value than expected from their age). Controls (green) and athletes (red) with associated linear regressions and 95% confidence intervals.

