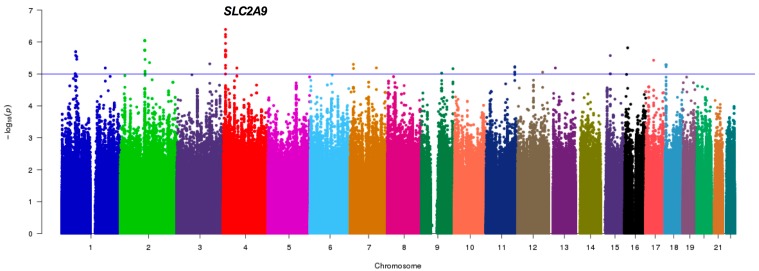
Figure 1.
Pilot GWAS for the Serum Uric Acid (SUA) levels in the discovery sample. Manhattan plot for SUA showing the -log10 transformed p-value of SNPs for 411 Mexican postmenopausal women from HWCS. The blue line indicates the established threshold value of p < 1.0 × 10⁻⁵. The gene closest to the SNP with the lowest p-value is indicated.

