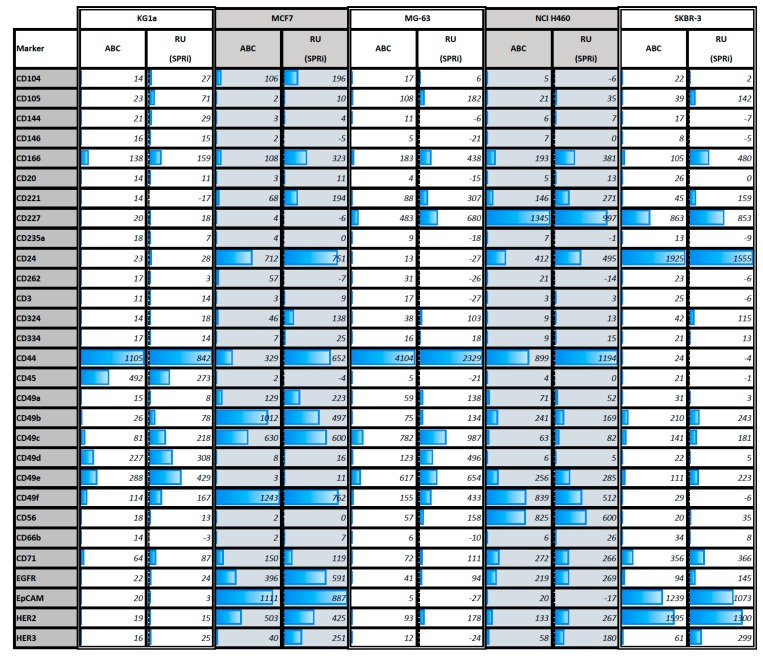
Figure 3.
Graphical representation of the result table. The flow cytometric Antibody Bound per Cell (ABC) values and Resonance Units (RU) values of SPRi of five different cell lines are shown for 28 markers. In total, 16 markers were left out because these markers did not show any or a very weak response for all five cell lines (for the full unedited table including correlations see Supplemental Table S1). The total SPR signal per column was used to normalize the ABC signal with the SPR signal. It shows that all cell lines are different but some lines are “closer” to each other. E.g., the cell line KG1a and MG63 (ATCC CRL-1427™) behave similar over the various markers but are different with respect to CD45.

