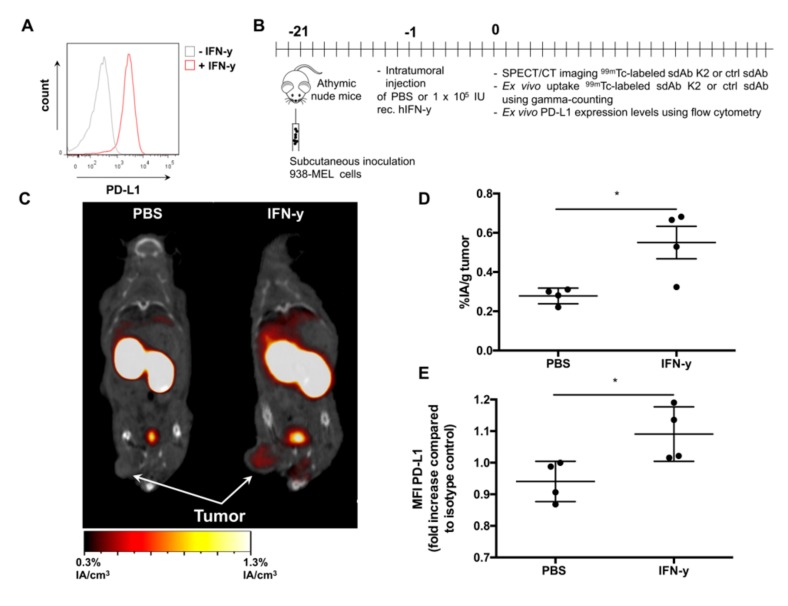
Figure 5.
Radiolabeled sdAb K2 allows specific visualization of human PD-L1 induced by IFN-γ in 938-MEL tumors. (A) Representative histogram showing PD-L1 expression after in vitro stimulation of 938-MEL cells with 100 IU/mL recombinant human IFN-γ (red) or non-treated 938-MEL cells (grey), as evaluated by flow cytometry analysis. (B) Scheme of the experimental setup. (C) Representative SPECT/CT images one hour after i.v. administration of 99mTc-K2 in athymic nude mice bearing PD-L1NEG 938-MEL tumors that were injected i.t. with PBS (left) or human recombinant IFN-γ (right) (n = 4). (D) Accumulation of 99mTc-K2 in 938-MEL tumors (expressed as %IA/g) that were treated i.t. with PBS or IFN-γ, as determined by γ-counting of dissected tumors 80 minutes after radiotracer injection (n = 4). (E) Human PD-L1 expression levels in 938-MEL tumors treated i.t. with PBS or IFN-γ. PD-L1 expression was evaluated by flow cytometry analysis of dissected and dissociated tumors. PD-L1 levels were depicted as fold increase in mean fluorescence intensity (MFI) as compared to isotype control staining (n = 4). * p < 0.05.

