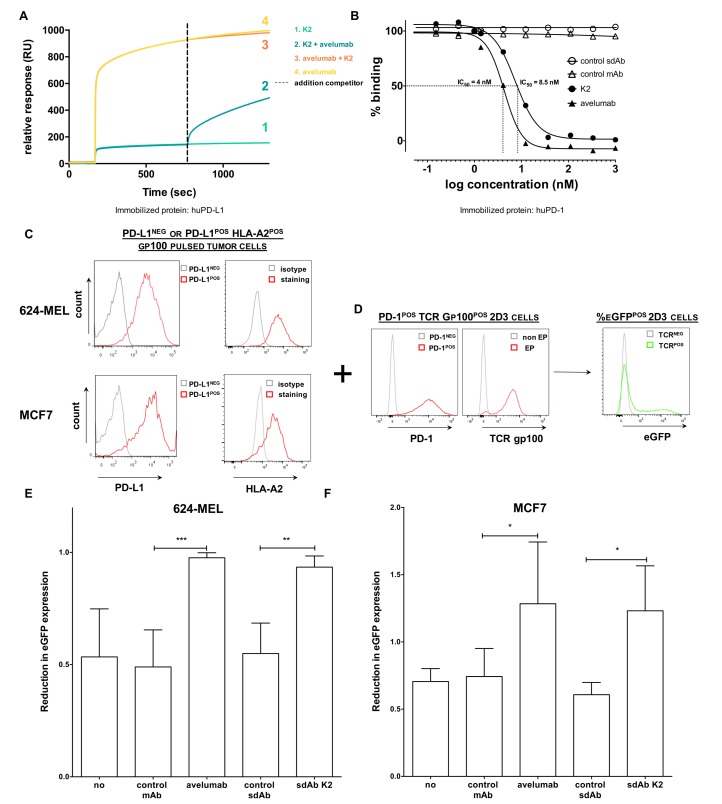
Figure 6.
sdAb K2 and avelumab antagonize PD-1:PD-L1 interactions. (A) A competition study with equimolar amounts of avelumab and sdAb K2 shows that both bind the same epitope on human PD-L1 as determined by SPR. (B) Dose response curves of soluble recombinant human PD-L1 protein mixed with increasing concentrations of sdAb K2, control sdAb, avelumab or control mAb, to immobilized human PD-1 recombinant protein, as determined by SPR. Per condition, maximal signal is shown relative to the sample that only contains recombinant PD-L1 protein. A representative experiment out of two independent experiments is shown. (C,D) Schematic representation of the experimental set up of the PD-1POS 2D3 reporter assay. (C) Representative flow cytometry histograms showing PD-L1 and HLA-A2 expression in HLA-A2POS PD-L1NEG (grey) or HLA-A2POS PD-L1POS (red) 624-MEL or MCF7 cells. (D) Representative flow cytometry histograms showing PD-1NEG (grey) or PD-1POS (red) 2D3 cells electroporated with mRNA encoding a TCR recognizing gp100 in the context of HLA-A2 (red). HLA-A2POS PD-L1POS or HLA-A2POS PD-L1NEG 624-MEL or MCF7 cells are pulsed with a human gp100280–288 peptide. These cells are co-cultured with PD-1POS 2D3 cells expressing a TCRαβ recognizing gp100280–288 in the context of HLA-A2 either or not in combination with 360 nM of sdAbs or mAbs. When the gp100280–288 peptide is recognized by the TCR on the 2D3 cells, this will lead to eGFP upregulation by the 2D3 cells (right). (E,F) Both avelumab and sdAb K2 revert the suppressive effect of PD-L1 expressed on 624-MEL (E) or MCF7 (F) cells on the activation of PD-1POS 2D3 reporter cells. The graphs depict the reduction in eGFP expression by PD-1POS 2D3 cells when co-cultured with PD-L1POS cancer cells compared to their co-culture with PD-L1NEG cancer cells (mean ± SEM, n = 3). No treatment, a control sdAb or an isotype control mAb served as negative controls. Percentage eGFPPOS CD8POS PD-1POS 2D3 cells was evaluated using flow cytometry. * p < 0.05, ** p < 0.01, *** p < 0.001.

