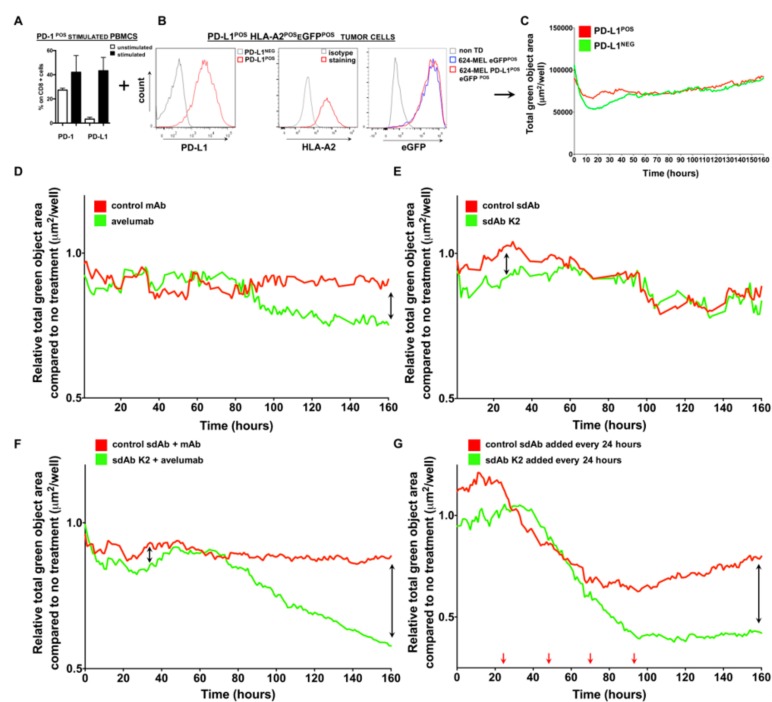
Figure 7.
sdAb K2 and avelumab show in vitro therapeutic efficacy, albeit with different kinetics. (A–C) Schematic representation of the experimental setup. (A) Bar graph showing the percentage of PD-1 or PD-L1 expression on CD8POS T cells present within unstimulated PBMCs (white bars) or PBMCs stimulated with anti-CD3 mAb and IL-2 (black bars). The mean ± SEM are shown (n = 3). (B) Representative histograms showing expression of PD-L1, HLA-A2 and eGFP by engineered 624-MEL cells (n = 3). (C) Activated PBMCs were added to HLA-A2POS, eGFPPOS and PD-L1POS 624-MEL cells or to HLA-A2POS, eGFPPOS and PD-L1NEG 624-MEL cells that were grown in 3D spheroids. The total green object area (μm2/well), representing viable tumor cells, was measured every hour for seven constitutive days using the IncuCyte Zoom® live cell imaging system and is shown in the graph (n = 3). (D–G) Activated PBMCs were added to HLA-A2POS, eGFPPOS and PD-L1POS 624-MEL cells that were grown in 3D spheroids in the absence or presence of PD-L1 blocking agents. The total green object area (μm2/well), representing viable tumor cells, was measured every hour for seven constitutive days using the IncuCyte Zoom® live cell imaging system and is shown in the graphs. (D) Tumor cell killing in the presence of 3.6 μM avelumab (green curve) or 3.6 μM control mAb (red curve). (E) Tumor cell killing in the presence of 3.6 μM sdAb K2 (green curve) or 3.6 μM control sdAb (red curve). (F) Tumor cell killing in the presence of 3.6 μM sdAb K2 and 3.6 μM avelumab (green curve) or 3.6 μM control sdAb and 3.6 μM control mAb. (G) Tumor cell killing when 3.6 μM sdAb K2 (green curve) or 3.6 μM control sdAb (red curve) is added every 24 hours (indicated with red arrows).

