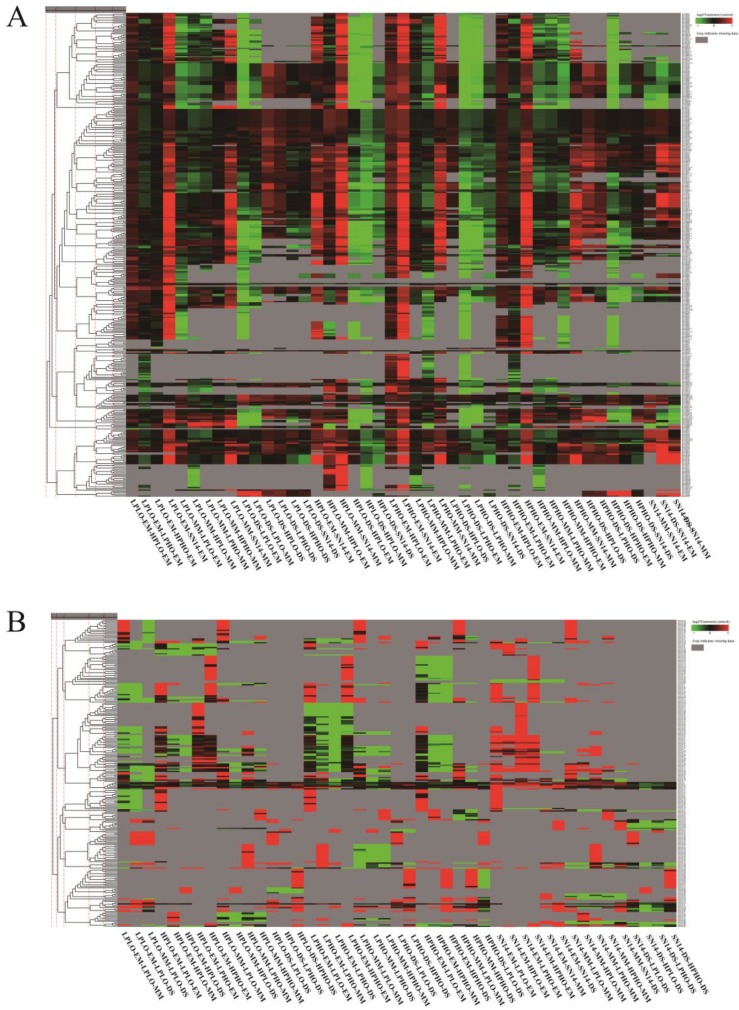
Figure 4.
Cluster analysis of miRNAs with similar expression patterns. The heatmap showed miRNAs for each cluster that were significantly expressed in control, HPHO, HPLO, HOLP and LPLO at the EM, MM and DS stages, respectively. The Samples with miRNA expression levels higher than control material showed color red, the Samples with miRNA expression levels lower than control material showed color green, and the color gray indicates that the miRNA is not expressed in at least one sample. (A) Cluster analysis of known miRNAs, (B) Cluster analysis of novel miRNAs.

