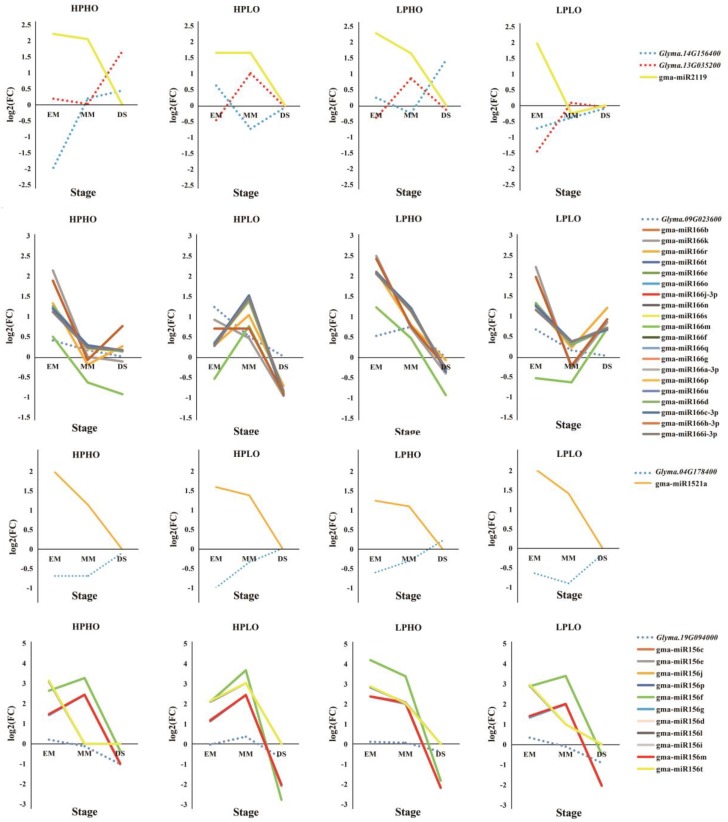
Figure 6.
Expression relationship between miRNA and its target gene. The dotted line represented the trend of the gene expression in each stage. The solid line represented the trend of miRNA expression in various stages. The X-axis represents the developmental stage of the seed, and the Y-axis represents the relative expression level.

