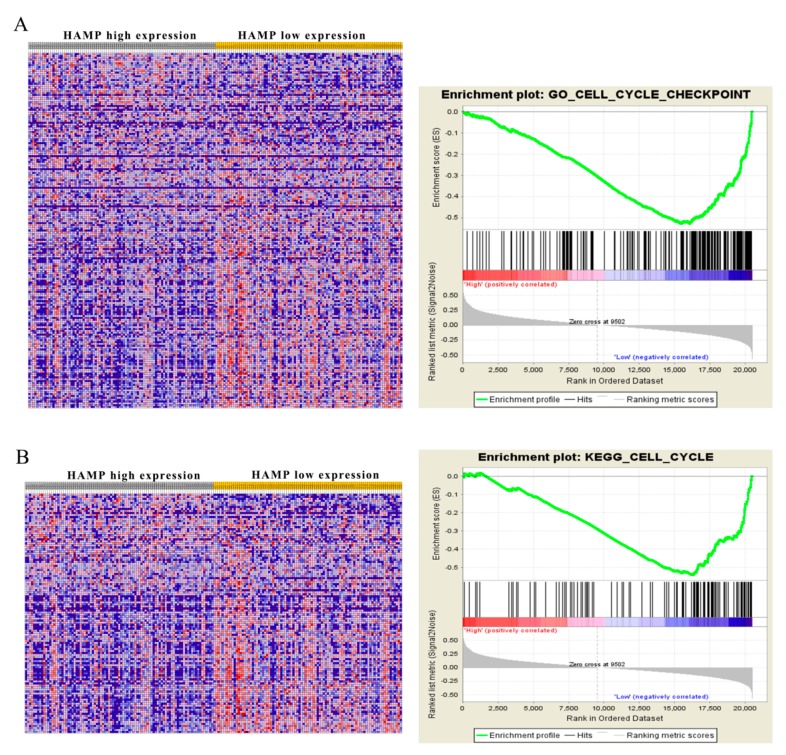
Figure 5.
Gene set enrichment analysis (GSEA) based on HAMP expression in HCC patients. To identify pathways linked to HAMP expression in The Cancer Genome Atlas (TCGA) samples, we compared gene expression in those with low HAMP expression (blue) and high HAMP expression (red). Visualizations were produced using Cytoscape and Enrichment map (1% FDR, p < 0.005). Each node is representative of a set of enriched genes, with annotations being ascribed based on how similar the sets are to one another. A network of nodes was used to map the enrichment results, with the size of nodes being directly correlated with the gene number in that particular gene set. The number of genes shared between two given gene sets determined the thickness of the green line connecting them. The final map was generated via removal of any general or noninformative smaller networks in order to simplify the final diagram. (A) Go enrichment plot showed HAMP downregulation is related to cell cycle checkpoint. (B) KEGG enrichment plot showed HAMP downregulation is related to the cell cycle.

