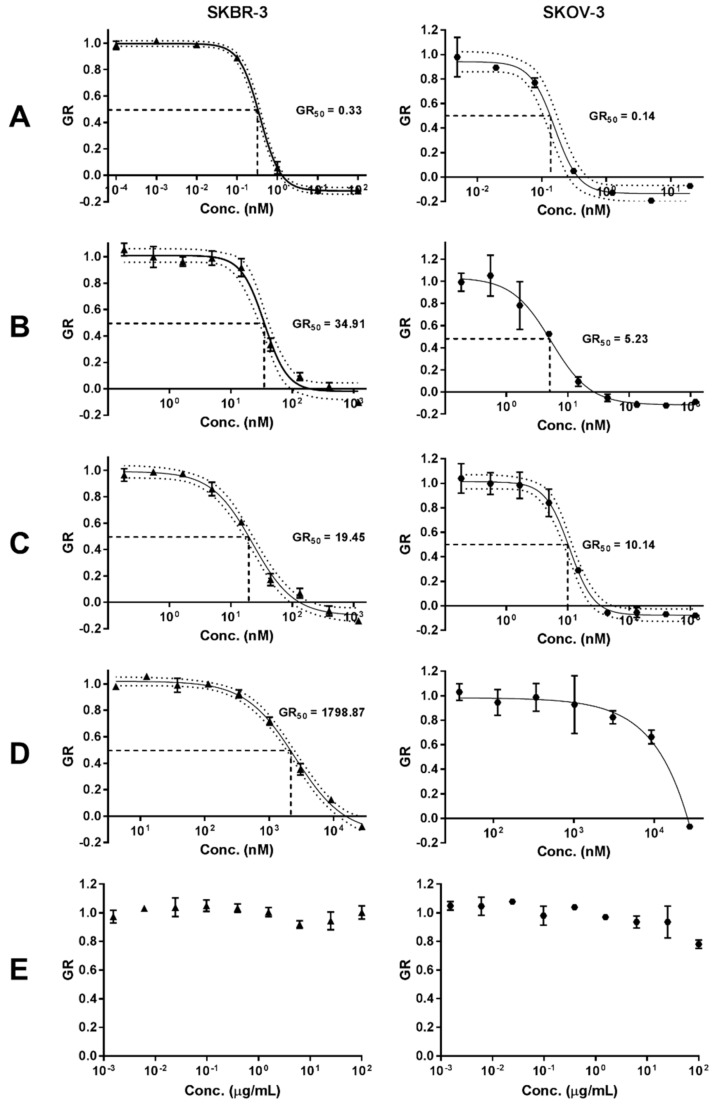
Figure 9.
Growth rate (GR) inhibition of (A) free MMAE, (B) ADC, (C) ADC-PEG-AuNP, (D) Trastuzumab and (E) OH-PEG-AuNP in SKBR-3 and SKOV-3 cell lines. Data are reported as means ± SD. 95% confidence bands are displayed as dotted lines. Concentration of ADC and ADC-PEG-PEG are reported as molar concentrations of MMAE according to the estimated DAR and number of ADC per AuNP, respectively.

