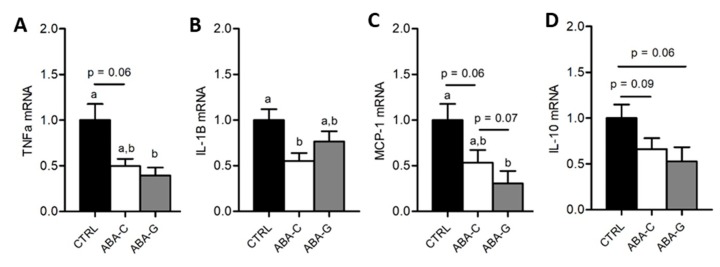
Figure 5.
mRNA levels of colonic cytokines. The mRNA levels of colonic pro- and anti-inflammatory cytokines were evaluated by RT-qPCR for Gln experimentation: TNF-α (A), IL-1β (B), MCP-1 (C) and IL-10 (D). Column bar graphs showed control mice (CTRL; black bars, n = 16), non-supplemented activity-based anorexia mice (ABA-C; open bars, n = 16) and supplemented activity-based anorexia mice (ABA-G; grey bars, n = 12). Values without a common letter significantly differ (p < 0.05).

