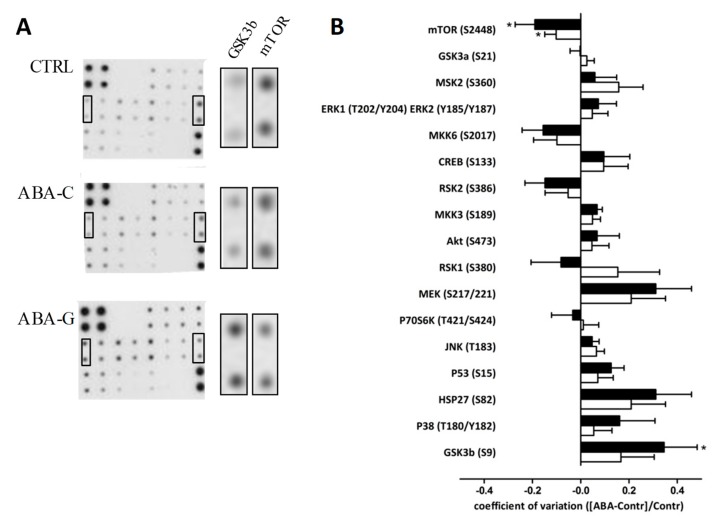
Figure 7.
Colonic phosphorylation levels of proteins involved in signaling pathways. Phosphorylation levels of 17 proteins involved in the signaling pathway were evaluated by the MAPK array kit. Representative membranes are shown (A) for each group: CTRL, ABA-C and ABA-G, (n = 8 /group). Horizontal graph bar columns (B) show differential ratio levels in ABA-C (open bars) and ABA-G (black bars) compared to control mice. *: p < 0.05 vs. CTRL.

