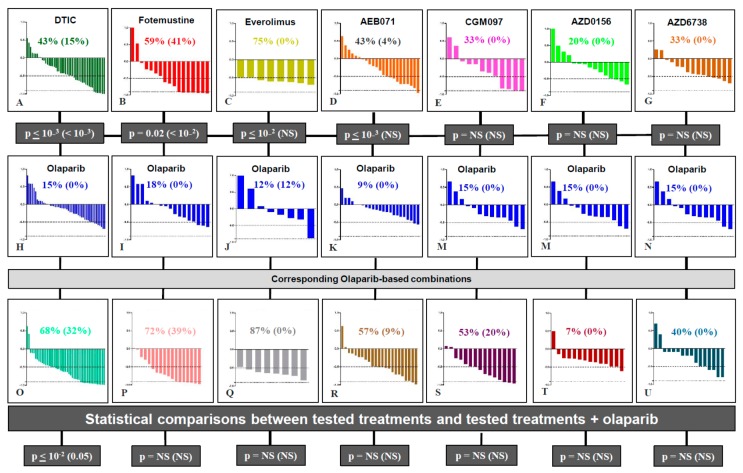
Figure 2.
Waterfall plots of response to olaparib-based therapies. Upper p values correspond to statistical differences between olaparib compared to each other tested treatment; p values at the bottom correspond to statistical differences between each tested treatment compared to its combination with olaparib (χ2 test).

