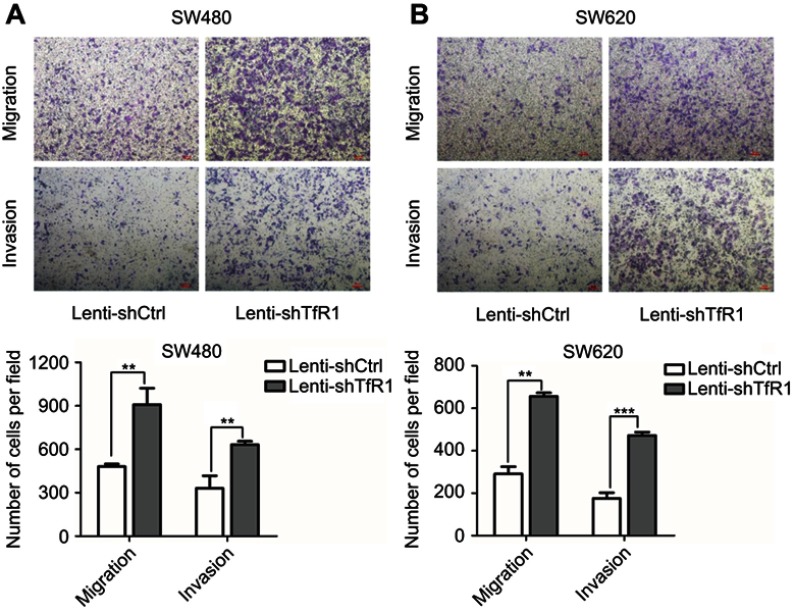
Figure 7.
TfR1 downregulation promoted migration and invasion of CRC cells. (A) In SW480, the number of migration cells per field was 908±113 in TfR1 knockdown cells vs 480±18 in control cells, and the number of invasion cells per field was 632±23 in TfR1 knockdown cells vs 331±84 in control cells (**P<0.01). (B) In SW620, the number of migration cells per field was 656±17 in TfR1 knockdown cells vs 290±34 in control cells (**P<0.01), and the number of invasion cells per field was 472±16 in TfR1 knockdown cells vs 165±26 in control cells (***P<0.001).

