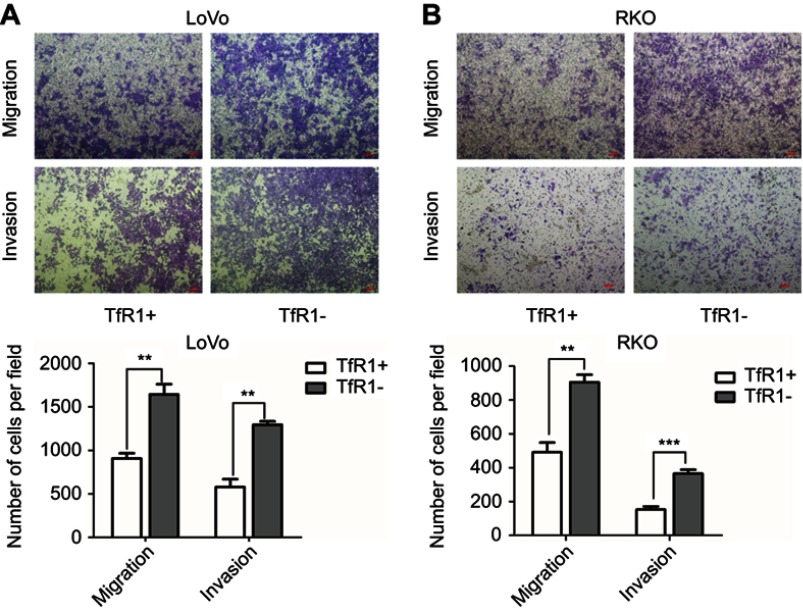
Figure 8.
Migration and invasion abilities of TfR1-negative CRC cells were stronger than TfR1-positive cells. (A) In LoVo, the number of migration cells per field was 1642±118 in TfR1-negative cells vs 906±60 in TfR1-positive cells, and the number of invasion cells per field was 1293±39 in TfR1-negative cells vs 579±89 in TfR1-positive cells (**P<0.01). (B) In RKO, the number of migration cells per field was 905±44 in TfR1-negative cells vs 492±56 cells in TfR1-positive cells (**P<0.01), and the number of invasion cells per field was 365±24 in TfR1-negative cells vs 153±18 in TfR1-positive cells (***P<0.001).

