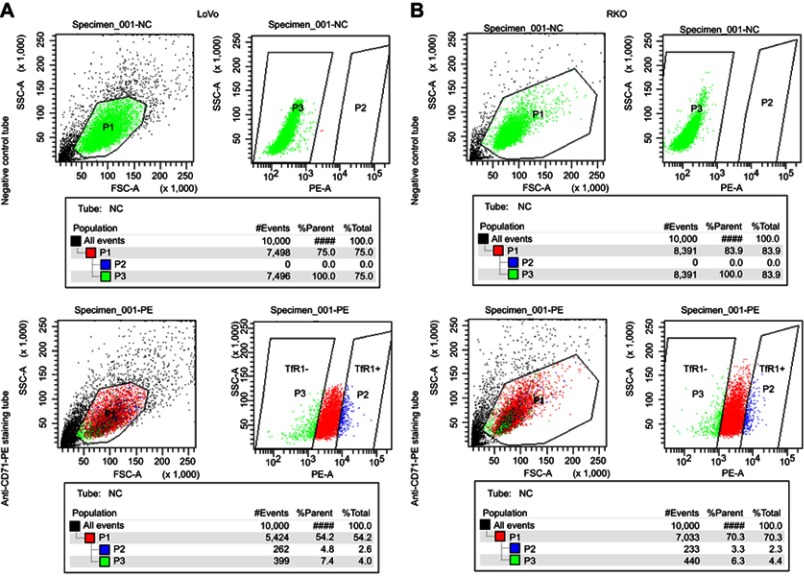
Figure S1.
The cell sorting plot for flow cytometry sorting. The negative control tubes were null cells without any staining, which were used for determination of TfR1-negative plot (green). The rightmost cell population in staining tubes were chosen as TfR1-positive plot (blue). (A) is the sorting plot for LoVo and (B) is for RKO.

