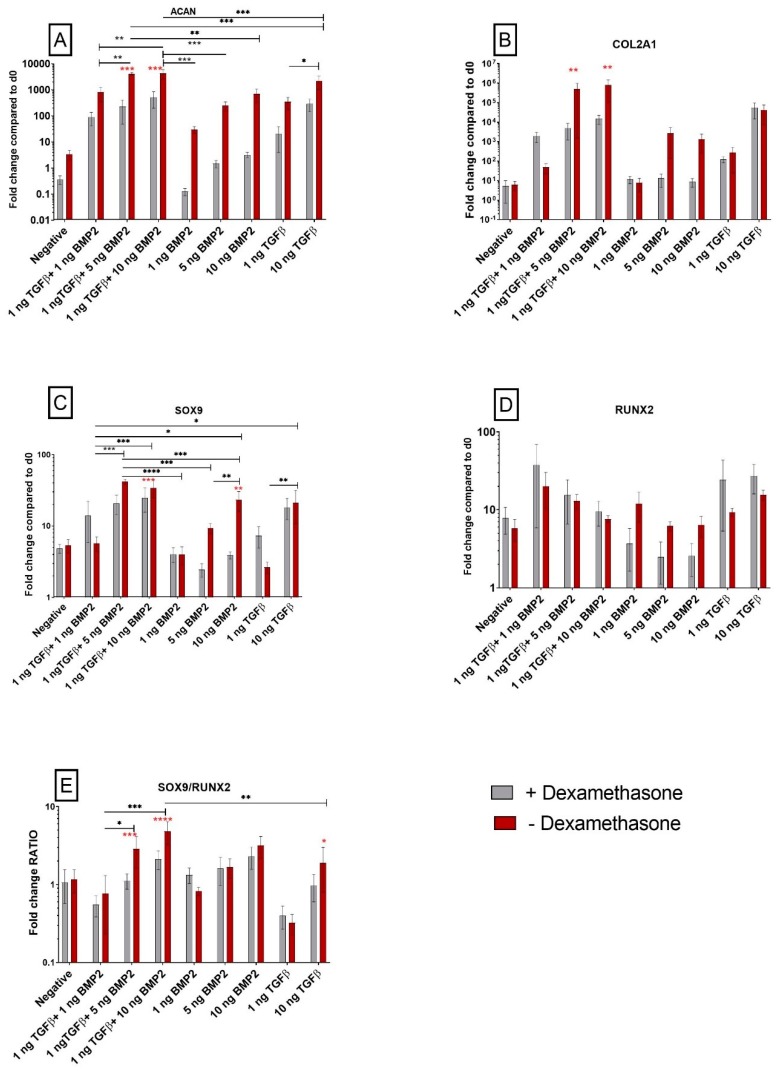
Figure 1.
Effect of TGF-β1 and BMP-2 on the expression of genes orchestrating human synovial-derived stromal cell (hSDSC) chondrogenic commitment. Cells were induced to chondrogenic differentiation for 21 days in the presence (positive control) or absence (negative) of 10 ng/mL TGF-β1. Experimental groups contained low TGF-β1 concentrations (1 ng/mL TGF-β1), various concentrations of BMP-2 alone (1 ng/mL BMP-2, 5 ng/mL BMP-2, 10 ng/mL BMP-2), or BMP-2 in combination with 1 ng/mL TGF-β1 (1 ng/mL TGF-β1+1 ng/mL BMP-2, 1 ng/mL TGF-β1+5 ng/mL BMP-2 and 1 ng/mL TGF-β1+10 ng/mL BMP-2). The amounts of ACAN (A), COL2A1 (B), SOX9 (C), RUNX2 (D) mRNA were normalized to 60S acidic ribosomal protein P0 (RPLP0) and SOX9/RUNX2 ratio (E) was calculated as the ratio between the fold change of each gene. The levels of gene expression of cells exposed to different media in the presence or absence of 100 nM dexamethasone were plotted as a fold change relative to the expression of the corresponding gene in undifferentiated cells (hSDSC day 0) defined as 1 (mean ± standard deviation (SD); n = 4). All data from 10 ng/mL TGF-β1 (positive control), low TGF-β1 concentration (1 ng/mL TGF-β1), and 1 ng/mL TGF-β1 combination with BMP-2 (1 ng/mL TGF-β1 + 1 ng/mL BMP-2, 1 ng/mL TGF-β1 + 5 ng/mL BMP-2 and 1 ng/mL TGF-β1 + 10 ng/mL BMP-2) were significantly different from negative control. Grey bars represent scatterplot of different measurements in hSDSC exposed to dexamethasone; red bars represent scatterplot of different measurements in hSDSC not exposed to dexamethasone. Data are expressed as mean ± SD, significant differences from dexamethasone treatment in the same group are marked by red asterisks; significant differences among group are marked by black asterisks (* p ≤ 0.05, ** p ≤ 0.01, *** p ≤ 0.001, **** p ≤ 0.0001).

