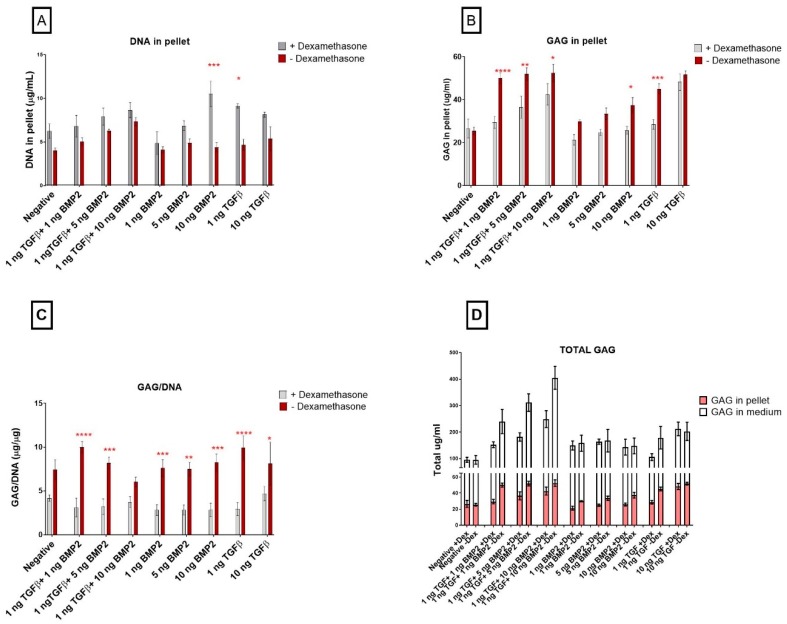
Figure 4.
The effect of dexamethasone on glycosaminoglycan and DNA content in the pellets. Cells were cultured for 21 days in the presence of 10 ng/mL TGF-β1 (positive control) or in its absence (negative), low TGF-β1 concentration (1 ng/mL TGF-β1), various concentration of BMP-2 alone (1 ng/mL BMP-2, 5 ng/mL BMP-2, 10 ng/mL BMP-2) or BMP-2 in combination with TGF-β1 (1 ng/mL TGF-β1 + 1 ng/mL BMP-2, 1 ng/mL TGF-β1 + 5 ng/mL BMP-2 and 1 ng/mL TGF-β1 + 10 ng/mL BMP-2) (A). The amount of glycosaminoglycans in the pellets were normalized to the DNA content (B) (mean ± SD; n = 4). Total GAG is shown as GAG released in the medium (white bars) plus GAG retained inside the pellets (pink bars) (C). Grey bars represent different measurement in hSDSC exposed to dexamethasone, red bars different measurement in hSDSC in dexamethasone-free media. DNA content for pellets are shown in panel (D). Data are expressed as mean ± SD, significant difference from dexamethasone treatment in the same group is marked by red asterisks; significant difference among groups is marked by black asterisks (* p ≤ 0.05, ** p ≤ 0.01, *** p ≤ 0.001, **** p ≤ 0.0001).

