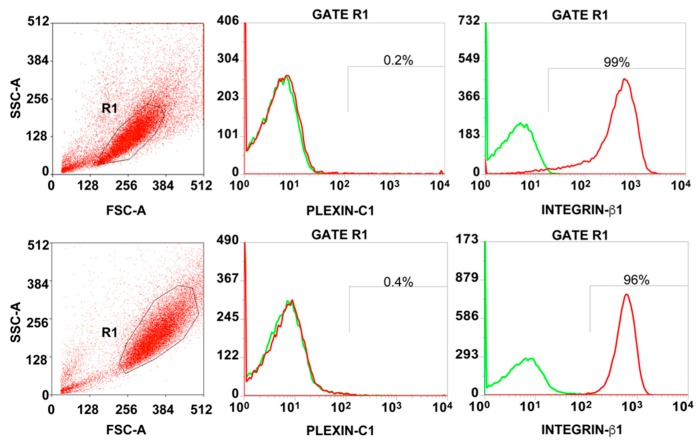
Figure 3.
Expression of SEMA7A (Semaphorin7A) receptors on Glioma Stem Cells (GSC). Representative flow cytometry analysis showing the level of Plexin C1 and Integrin β1 on the surface of two GSC cell populations. The percentage of positive cells was calculated within the R1-Gate, representing the GSC population based on forward and side scatter (FSC/SSC) parameters. Histograms overlays show isotype control staining profile (green histograms) versus specific antibody staining profile (red histograms).

