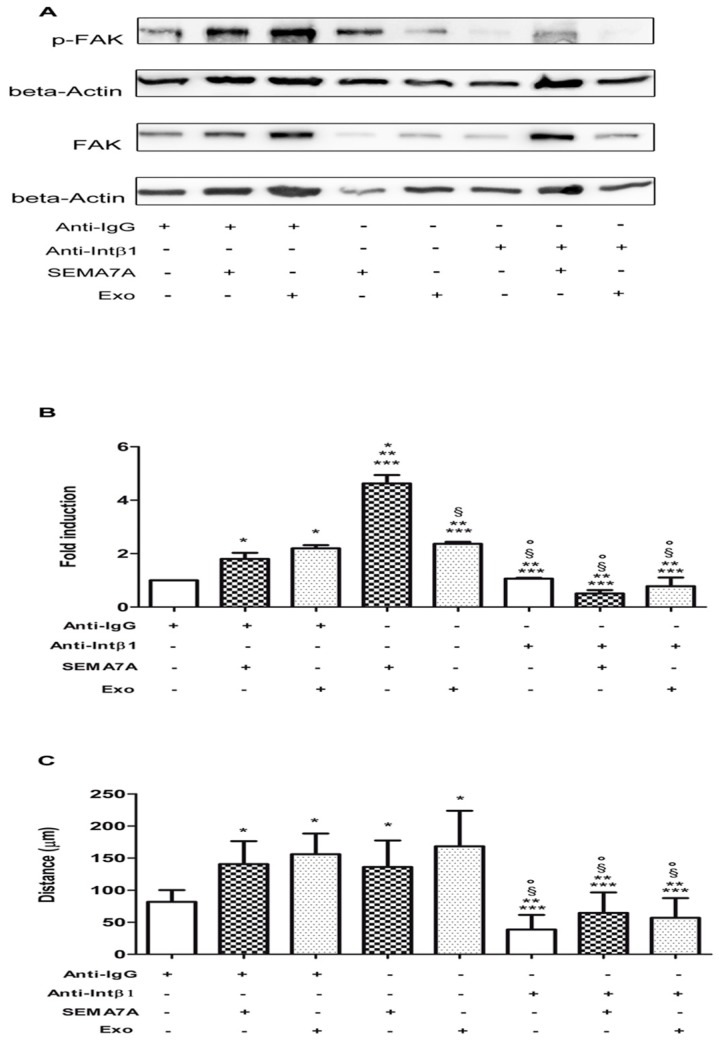
Figure 6.
Blocking integrin beta1 on GSC (Glioma Stem Cells) affects the activation of Focal Adhesion Kinase (FAK) signalling and the motility of Glioma Stem Cells (GSC) induced by either Semaphorin7A (SEMA7A) or Glioma Associated Stem Cells (GASC)-derived exosomes. (A) Representative Western blotting for FAK and pFAK of GSC treated with anti-Immunoglobulin G (Anti-IgG) antibody, 5 µg/mL for 65 min, anti-Immunoglobulin G (anti-IgG)antibody, 5 µg/mL for 60 min and SEMA7A 100 ng/mL for 5 min, anti-IgG antibody 5 µg/mL for 60 min and GASC-derived exosomes 10 μg/mL for 5 min, SEMA7A 100 ng/mL for 5 min, GASC-derived exosomes 10 μg/mL for 5 min, anti-Integrin beta 1 blocking antibody 5 µg/mL for 65 min, anti-Integrin blocking antibody 5 µg/mL for 60 min and SEMA7A 100 ng/mL for 5 min and anti-Integrin blocking antibody 5 µg/mL for 60 min and GASC-derived exosomes 10 μg/mL for 5 min. (B) Densitometric analysis was performed using the software available in the Gel-doc instrument (Alliance Uvitec, Ltd. Cambridge, UK) to quantify the level of FAK phosphorylation. The histogram represents results reported as the Fold Change of p-FAK of different treatments vs. cells treated with the anti-IgG antibody. Values were calculated as the ratio of IOD (Integrated Optical Density) pFAK/FAK after normalisation on beta actin level. (C) A motility assay was performed in cells treated as described in B. Histogram represents the distance covered after 8 h, calculated measuring the width of the gap between the two margins of scratched monolayer. Data are presented as means ± standard deviation of 4 replicates. * p < 0.05 vs. Anti-IgG, ** p < 0.05 vs. Anti-IgG+SEMA-7A, *** p < 0.05 vs. Anti-IgG+ Exo, § p < 0.05 vs. SEMA-7A, ° p < 0.05 vs. Exo. Statistical analysis was performed by repeated measurements one-way ANOVA followed by Bonferroni Multiple Comparison post-test (GraphPad Prism 5, San Diego, California).

