Figure 3.
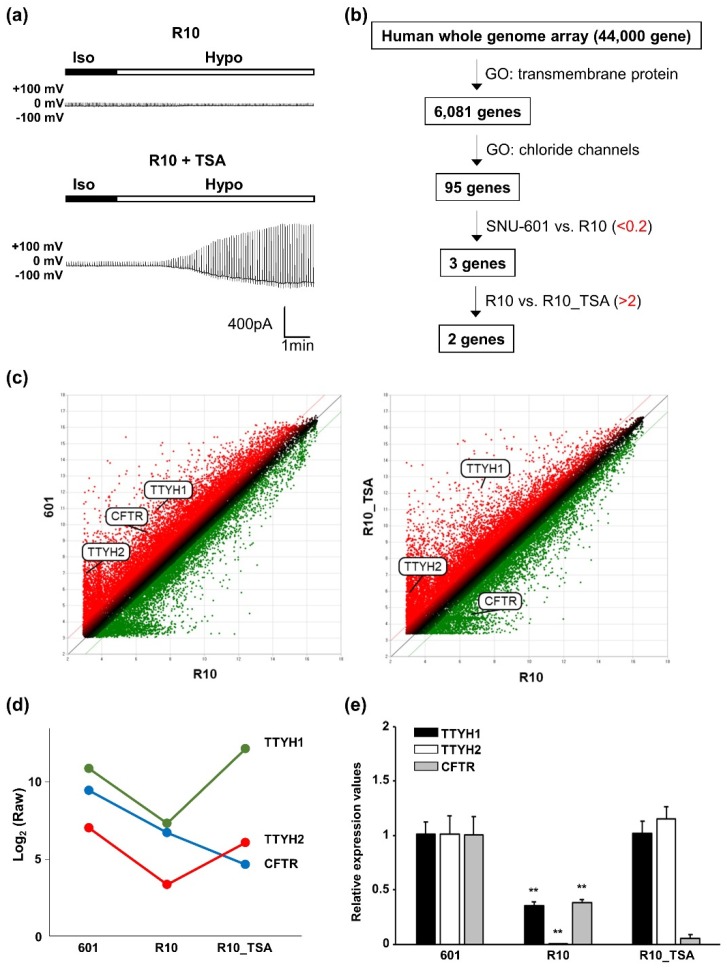
TTYH1 and TTYH2 are candidate VRACs in SNU-601 cells. (a) Representative traces showing the time course of volume-activated chloride currents elicited by alternating pulses by voltage ramp from −100 to +100 mV, in R10 and TSA-treated R10 cells. (b) Schematic overview of our human whole-genome array screen to identify candidate VRAC components. (c) Scatter plots of log2 (Raw) for every gene in SNU-601 vs. R10 and TSA-treated R10 vs. R10. (d) Dot plots of expression levels of TTYH1, TTYH2, and CFTR in SNU-601, R10, and TSA-treated R10 cells samples, calculated rom array data. (e) Real-time PCR quantification of fold changes in TTYH1, TTYH2, and CFTR mRNAs in SNU-601, R10, and TSA-treated R10 cells. Data are presented as means ± SEM (** P < 0.01).

