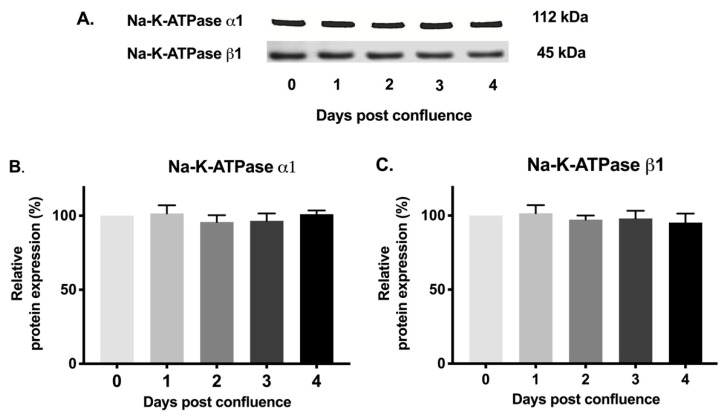
Figure 7.
Western blot analysis of IEC-18 cells in plasma membrane fractions. (A). Representative blots of Na-K-ATPase α1 and Na-K-ATPase β1. Densitometric quantitation of Western blots. (B). Na-K-ATPase α1 and (C). Na-K-ATPase β1. Equal amount of proteins were loaded. Values are relative to 0-day and represented as mean ± SEM, n = 4.

