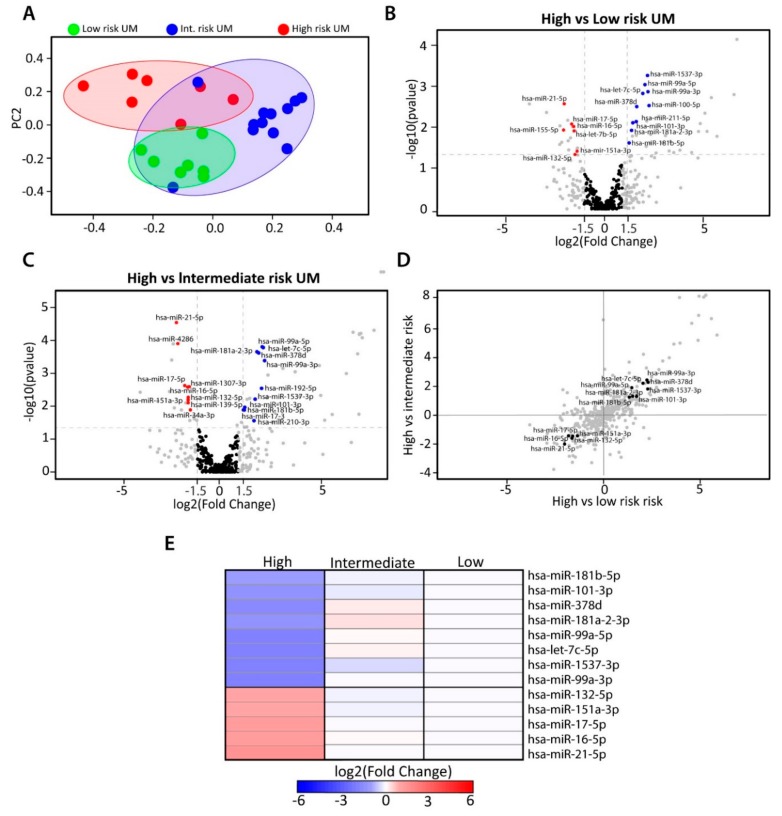
Figure 2.
Differential miRNA expression within UM subtypes. (A) Principal Component Analysis (PCA) plot showing the unsupervised clustering based on total miRNA expression of all samples. (B) Volcano plot indicating which miRNAs are differentially expressed between high- vs. low-risk UM. (C) High- vs. intermediate-risk UM. Blue dots indicate downregulation and red dots indicate upregulation of the miRNA (D) The correlation between high- vs. low-risk and high- vs. intermediate-risk UM (E) Heatmap showing the set of 13 miRNAs identified to be potentially involved in the high-metastatic-risk UM.

