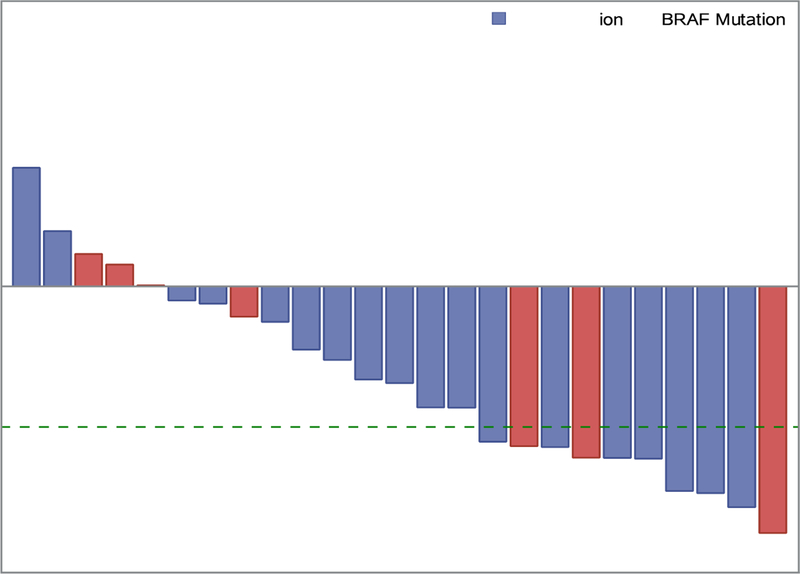
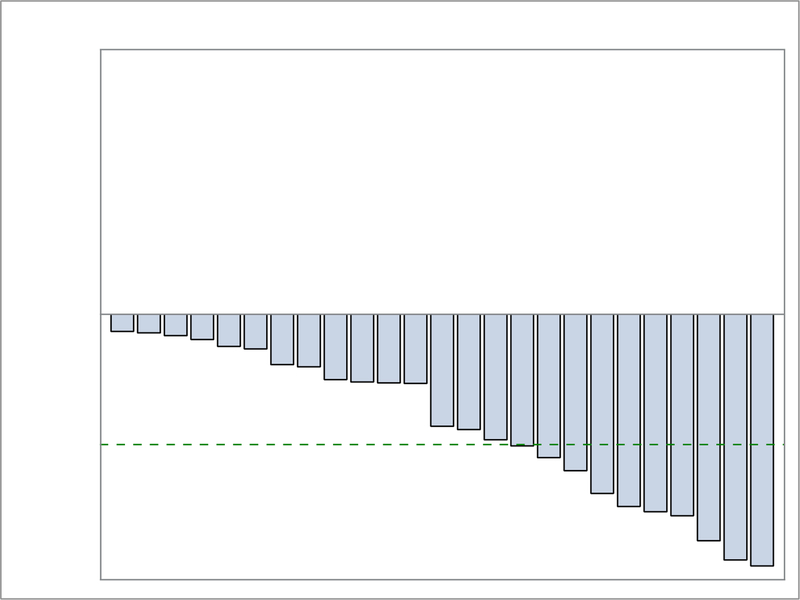
Figure 3.
Panel A: Stratum 1 waterfall plot depicting the maximum percentage change of two-dimensional tumor sizes during treatment from baseline by BRAF Status: KIAA1549-BRAF fusion and BRAFV600E mutation. The green dash line shows 50% tumor reduction from baseline which signifies a partial response (PR). Panel B: Stratum 3 waterfall plot depicting the maximum percentage change of two-dimensional tumor sizes during treatment from baseline. The green dash line shows 50% tumor reduction from baseline which signifies a partial response (PR).


