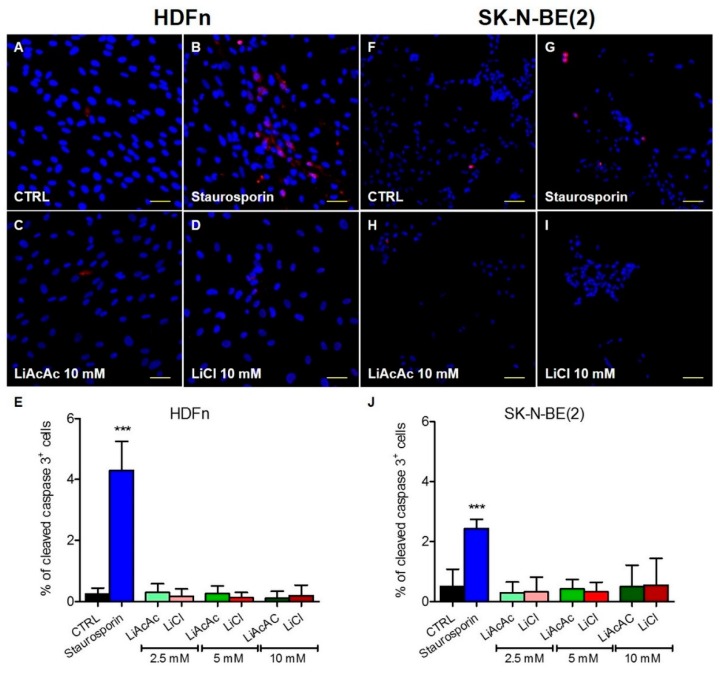
Figure 3.
Immunofluorescence staining of cleaved caspase 3 (red): HDFn (A–D) and SK-N-BE(2) (F–I) cells were treated with 2.5, 5, and 10 mM LiAcAc (C,H) or equimolar concentrations of LiCl (D,I) for 5 days. As positive control, cells were treated for 3 hours with staurosporin 1 µM (B,G). Nuclei are demarcated with DAPI (blue). Scale bar: 50 µM. Figure 3 (E,J) shows the percentage of cleaved caspase 3 positive HDFn (E) and SK-N-BE(2) (J) cells. Data are given as mean ± SD. A statistical analysis was performed by using one-way ANOVA (Dunnett’s Multiple Comparison Test); data are compared to untreated control cells: *** p < 0.001; n = 9–10 macroscopic fields.

