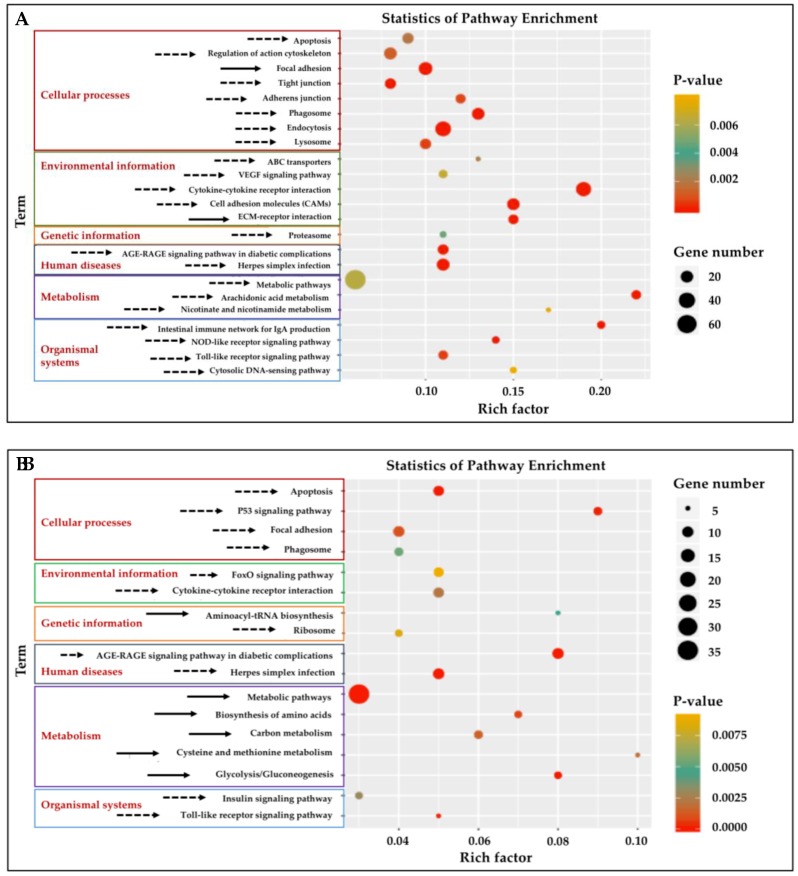
Figure 3.
Kyoto Encyclopedia of Genes and Genomes (KEGG) pathway analysis of enrichment of the DEGs from the gill and adipose fin. (A) Twenty-three KEGG pathways were enriched (p < 0.01) in the gill tissues by comparing the HT and NT groups. (B) Seventeen KEGG pathways were enriched (p < 0.01) in adipose fin tissues. Rich factor is the ratio of the number of DEGs to the total number of genes in a certain pathway. The size and color of the dots represent the number of genes and the range of the p values, respectively. Solid arrows indicate up-regulated pathways, and dotted arrows indicate down-regulated pathways.

