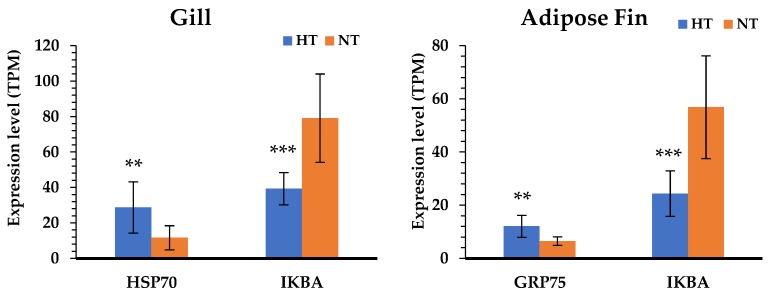
Figure 4.
Comparison of the gene expression level between the HT and NT groups determined by normalized reads (TPM). The blue bars represent the gene expression of the HT group; the orange bars represent the gene expression of the NT group. Differences in statistically significant expression are marked ((*) p < 0.05; (**) p < 0.01; (***) p < 0.001).

